Board Reporting for Private Equity Portfolio Companies: Why the Monthly Pack Takes Six People and Still Ships Wrong Numbers
The board deck lands 48 hours before the meeting, and the revenue number on slide 4 does not match the variance commentary on slide 11. The CFO spent six days reconciling HubSpot, NetSuite, and two regional Salesforce instances, and the sponsor's deal partner is now on a call asking which number to believe. This happens every month, and it happens because the board pack lives in a spreadsheet that four people patch by hand from five different exports.
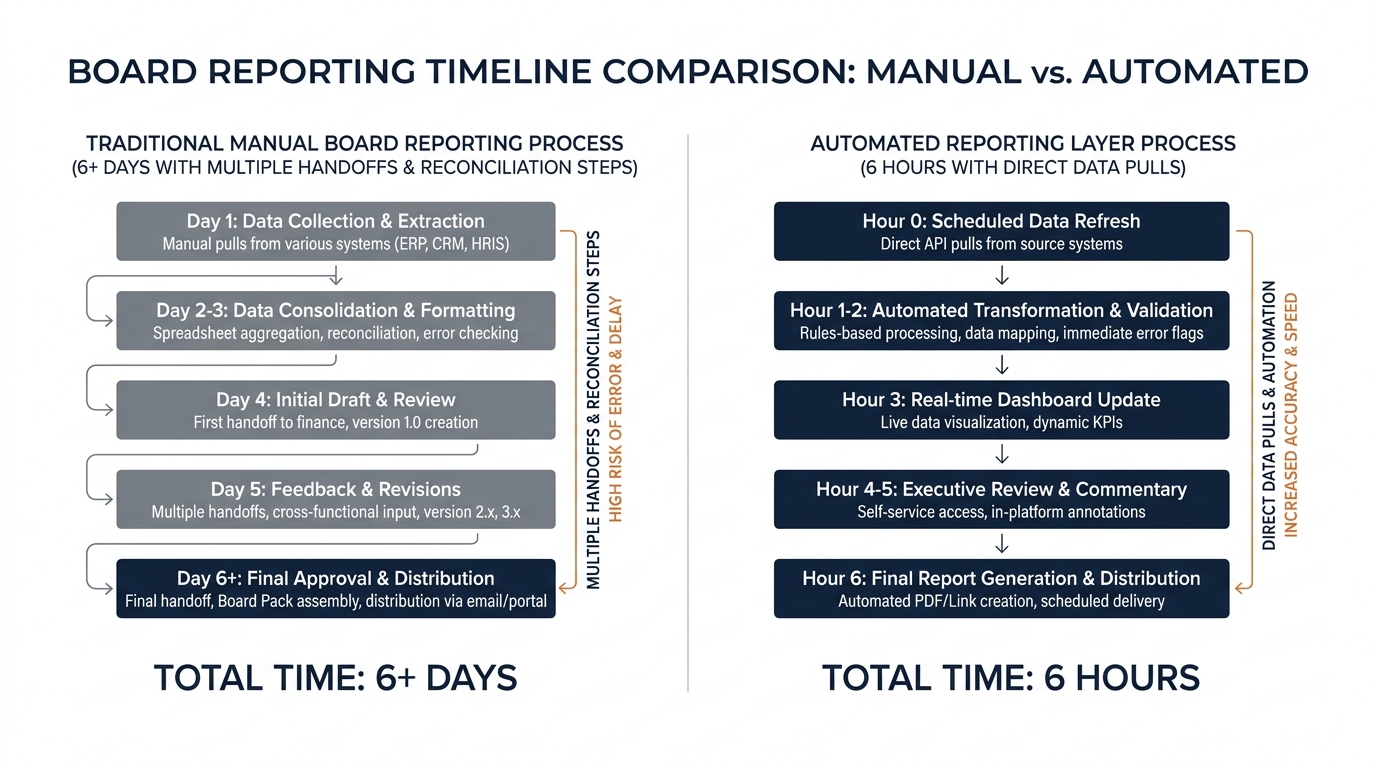
Board reporting for private equity portfolio companies is not a slide formatting problem. It is a data architecture problem that most firms solve with human reconciliation labour instead of a reporting layer that pulls one number from source systems. The result is forecast variance the sponsor cannot underwrite, six-day closes that should take six hours, and recognition timing errors that read as revenue quality issues when they show up in QoE.
Why the Monthly Pack Breaks Every Month
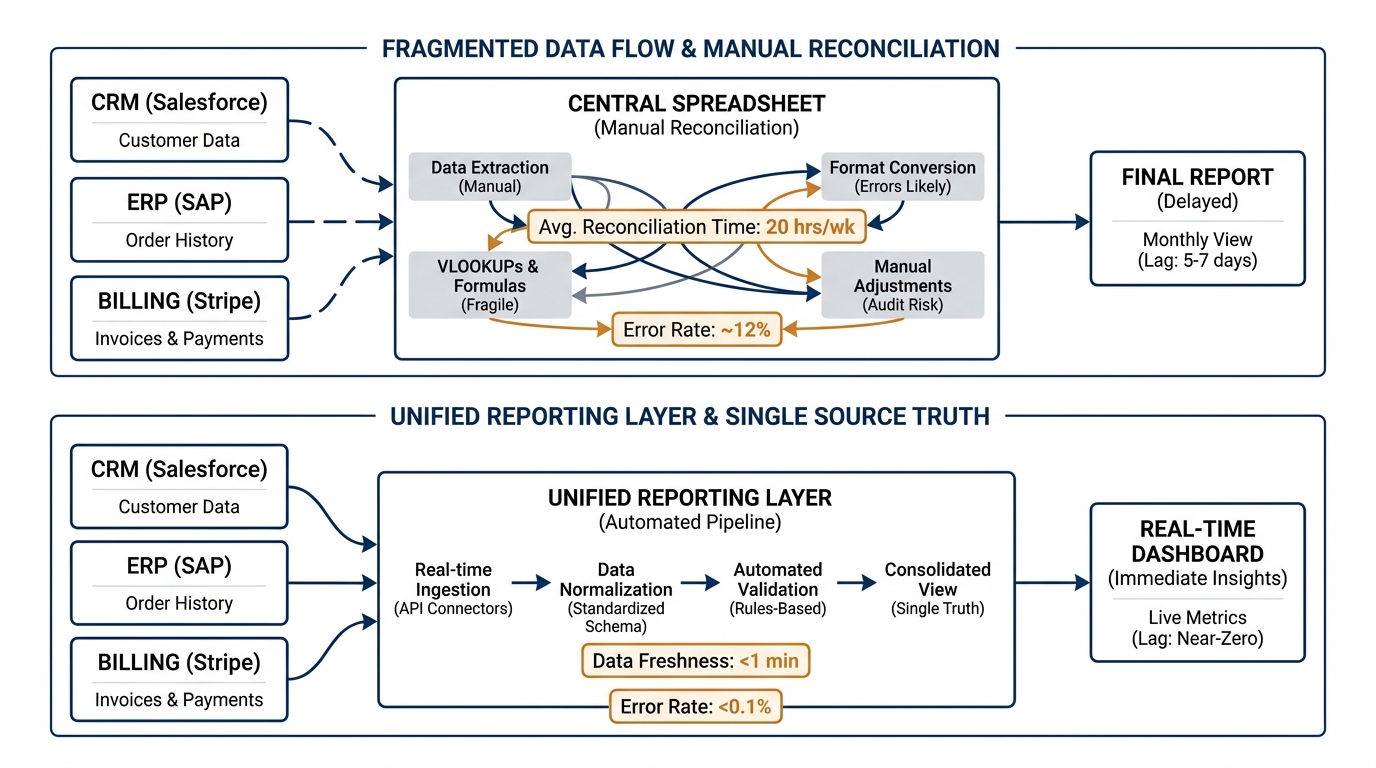
The typical mid-market portfolio company builds its board reporting stack from four components: a general ledger, a CRM, a billing system, and the spreadsheet the finance team uses to tie them together. Each system exports data on a different cadence, with different field names, and with recognition rules the other systems do not respect. HubSpot counts a deal as closed when the contract is signed; NetSuite recognizes revenue when the invoice posts; the billing system defers it across the subscription term; and the spreadsheet is where someone manually reconciles the three.
That reconciliation step is where board reporting fails. One analyst exports CRM pipeline on the 28th of the month. Another pulls actuals from the GL on the 2nd. A third updates the cash flow forecast from a separate model the FP&A team maintains. The CFO layers in adjustments for deferred revenue, writes variance commentary, and ships the deck. Two months later, the sponsor's operating partner asks why Q2 EBITDA dropped 8% from the forecast in the April board pack, and the finance team discovers that the CRM export they used for pipeline coverage was run before the sales team logged three late-quarter wins.
The problem is not the people. The problem is that a portfolio company leadership team is manually orchestrating a data pipeline that should be automated, and human reconciliation introduces timing errors, recognition mismatches, and version drift that compound across every reporting cycle.
The Three Failure Modes That Make Sponsors Doubt the Numbers
Sponsors lose confidence in portfolio company reporting when one of three patterns appears repeatedly: the revenue bridge does not tie to actuals, the forecast changes materially without explanation, or the numbers in the board deck do not match the numbers the operating team references in conversation. Each failure mode has a different root cause, and all three trace back to manual data assembly.
Recognition timing drift. A SaaS portco signs an annual contract in March, books the full ACV in the CRM, recognizes one-twelfth of it monthly in the GL, and invoices quarterly in the billing system. The board pack revenue number depends on which system the analyst exported from and when. If the CRM export runs before the billing system posts the invoice, the revenue line will be overstated. If the GL export includes an accrual adjustment the CRM does not reflect, the variance commentary will describe growth that the actuals do not show. The CFO reconciles it by hand, but the reconciliation itself is a point-in-time snapshot, and the snapshot goes stale the moment one system updates.
Version control failure. The FP&A team maintains the forecast model. The finance team pulls actuals. The CFO writes the variance narrative. Each person works from a different version of the spreadsheet, and the final deck is assembled by copying tabs from three separate files. Somewhere in that process, an old forecast overwrites a new one, or an updated actual does not make it into the variance calc, and the sponsor sees a 12% EBITDA miss that is actually a 4% miss plus an 8% version control error. This failure mode is invisible to the team assembling the deck because each person's individual export is correct; the error is in the merge.
Definitional inconsistency. Marketing reports leads. Sales reports pipeline. Finance reports bookings. The definitions do not align, and the board deck includes all three metrics without explaining that a lead in the marketing funnel may or may not become a qualified opportunity in the CRM, and a qualified opportunity may or may not convert to a booking in the period it was forecasted. When the sponsor's deal partner asks why Q3 pipeline coverage dropped from 2.1x to 1.7x while marketing-qualified leads grew 18%, the answer is that the two metrics measure different parts of the funnel with different counting rules, but that nuance was not in the deck, and the sponsor is now questioning whether the growth thesis is intact.
What a Reporting Layer Actually Does
A sponsor reporting layer is not a dashboard. It is a data model that sits between source systems and the board pack, with transformation rules that apply recognition timing, currency conversion, and definitional mappings once, in one place, so that every downstream report pulls the same number. The layer does not replace the GL, the CRM, or the billing system. It pulls from them, applies the business logic the board expects, and exposes a single version of truth that the CFO, the FP&A team, and the sponsor all query from the same source.
The reporting layer solves the three failure modes by eliminating manual reconciliation. Recognition timing is handled by the ETL pipeline that pulls CRM deals, billing invoices, and GL postings into a unified fact table with a single revenue recognition date. Version control is enforced by the data model itself: there is no spreadsheet to merge, no old forecast to overwrite, and no risk that two people are working from different versions. Definitional consistency is achieved by mapping source system fields to canonical business metrics in the transformation layer, so that a lead, a qualified opportunity, and a booking are all defined once, and every report that references them uses the same definition.
The realized value is not the dashboard. The realized value is that the CFO stops spending six days reconciling, the sponsor stops guessing which number to believe, and the finance team ships a board pack in six hours with forecast reliability the deal partner can underwrite.
How This Plays Out in a Real 100-Day Plan
A PE sponsor closes on a $180M software business in Q2. The value creation thesis includes three bolt-ons in the first 18 months, and the 100-day plan calls for a reporting layer that can absorb acquired entities without rebuilding the board pack from scratch each time. The portco CFO inherits five regional instances of Salesforce, two ERPs, and a spreadsheet-based consolidation process that takes nine days to close each month.
The operating partner's first request is a monthly EBITDA bridge that breaks out organic growth, acquisition contribution, and currency impact. The CFO cannot produce it without manually re-categorizing every revenue line in the consolidated P&L, and the manual re-categorization introduces errors that make the bridge unreliable. By month three, the sponsor has lost confidence in the forecast, and the deal partner is privately questioning whether the finance team can execute the integration plan.
The fix is a reporting layer that pulls CRM pipeline, ERP actuals, and billing data into a unified schema with tagging rules that apply acquisition attribution automatically. Each regional Salesforce instance maps to a geography dimension. Each acquired entity maps to an entity dimension. Revenue is tagged at the transaction level with both dimensions, and the EBITDA bridge is a query against the fact table, not a manual spreadsheet exercise. The CFO ships the first automated board pack in week 11 of the 100-day plan, and the close cycle drops from nine days to four.
The value to the sponsor is not the four-day close. The value is that the operating partner can now track organic EBITDA growth with confidence, the deal team can model bolt-on synergies against reliable actuals, and the portco finance team has capacity to support integration work instead of spending two weeks each month reconciling spreadsheets.
The Data Model That Makes Board Reporting Work
The reporting layer is built on three tables: a fact table that stores transactions, a dimension table that stores business context, and a metric table that stores calculated KPIs. The fact table holds every revenue transaction, expense line, and cash flow event from source systems, with foreign keys to the dimension table. The dimension table holds customer, product, geography, and entity metadata. The metric table holds EBITDA, ARR, pipeline coverage, and every other calculated number the board expects, with formulas that reference the fact and dimension tables.
This structure solves the recognition timing problem by storing every transaction with a source system timestamp, a booking date, and a recognition date. When the board pack needs recognized revenue, it queries the fact table filtered by recognition date. When the variance commentary needs bookings, it queries the fact table filtered by booking date. The two numbers come from the same source, with no manual reconciliation, and the CFO can explain the delta by pointing to the difference in filter logic, not by defending a spreadsheet formula someone else wrote.
The structure solves the version control problem by enforcing a single write path. The FP&A team does not maintain a separate forecast model. The forecast is a set of rows in the fact table with a forecast flag set to true. When actuals land, the ETL pipeline updates the fact table, and every report that queries the table sees the new actuals immediately. There is no merge step, no risk of an old forecast overwriting a new one, and no scenario where two people are looking at different numbers.
The structure solves the definitional consistency problem by mapping source system fields to canonical dimensions in the ETL layer. A lead in HubSpot is not the same as an opportunity in Salesforce, and an opportunity in Salesforce is not the same as a booking in the ERP. The dimension table defines each term once, and the ETL pipeline tags every transaction with the appropriate dimension value. When the board pack references pipeline, it is querying opportunities where stage equals qualified, and that definition is consistent across every report.
Why This Is an Operating Partner Problem, Not a CFO Problem
The CFO owns the board pack, but the operating partner owns the value creation plan, and unreliable board reporting is a value creation execution risk. When the sponsor cannot trust the forecast, the deal partner cannot underwrite the next bolt-on. When the EBITDA bridge does not tie to actuals, the IC cannot approve the pricing strategy that depends on margin expansion. When the portco leadership team spends six days each month reconciling instead of executing, the 100-day plan slips, and the exit timeline extends.
The operating partner's decision is not whether to build a reporting layer. The decision is whether to accept forecast variance as a permanent operating condition or to instrument the portfolio company with the data infrastructure that makes variance measurable and addressable. Most sponsors choose the former because the latter reads as a technology project, and technology projects in portfolio companies are historically high-risk. The difference in 2026 is that the reporting layer is no longer a custom-built data warehouse. It is a configuration exercise on top of modern ELT platforms that most mid-market companies already use for marketing operations and sales analytics.
The value creation impact is not speculative. A reliable reporting layer reduces forecast variance, shortens close cycles, and frees finance capacity for integration work. Those three outcomes show up in EBITDA, in synergy realization timelines, and in the confidence with which the deal team can model the next acquisition. The alternative is a board pack that ships late, with numbers the sponsor doubts, and a portco CFO who spends half of every month reconciling spreadsheets instead of supporting the operating plan.
What to Do on Monday
If you are an operating partner or a portfolio CFO, and your board reporting process takes more than two days to close, map the data flow from source systems to the final deck. Identify every manual export, every spreadsheet reconciliation, and every step where one person's output becomes another person's input. That map is your starting point. The reporting layer eliminates the handoffs by pulling directly from source systems and applying transformation logic once, upstream of the board pack.
If you are a deal partner evaluating a target, and diligence uncovers a nine-day close cycle with manual consolidation, price that risk into the forecast reliability assumption. A portco that cannot produce reliable actuals in less than a week will not be able to support a three-acquisition integration plan without material investment in finance infrastructure. That investment is not optional, and it is not a post-close surprise. It is a Day 1 operating reality that belongs in the value creation plan.
If you are a sponsor building a platform for multiple bolt-ons, instrument the reporting layer before the first acquisition closes. The incremental cost of adding a second entity to an existing data model is near zero. The cost of rebuilding the board pack from scratch after each acquisition is six weeks of finance capacity, repeated every time. The reporting layer is the infrastructure that makes a buy-and-build strategy executable, and it is cheaper to build once than to patch repeatedly.
DevriX operates a Sponsor Reporting Layer service for PE-backed portfolio companies that need to consolidate actuals, forecast, and variance reporting into a single source of truth. If you are an operating partner or CFO managing board reporting across multiple entities, the documented capability is at devrix.com/services/sponsor-reporting.
The Integration Decision Nobody Sees Coming
The reporting layer conversation surfaces six months after close, when the sponsor asks for consolidated actuals across three bolt-ons and the portco CFO replies that it will take four weeks to produce. The delay is not laziness or incompetence. It is the predictable consequence of integrating three companies that track revenue differently, define EBITDA differently, and close their books on different schedules. The reporting layer that worked for a single entity does not scale to a platform strategy, and the migration from three separate board packs to one consolidated view is not a weekend project.
The operating partner's mistake is not technical. It is assuming that reporting infrastructure is something you fix after the integration is complete, when in reality the reporting layer is the infrastructure that makes integration measurable. Without a single source of truth for actuals, the integration team cannot tell whether revenue synergies are realized or forecast, whether cost savings are run-rate or one-time, and whether the consolidated EBITDA number is accurate or an artifact of different accounting treatments across entities.
The fix is not a post-close rescue project. It is an M&A playbook that treats the reporting layer as Day 1 infrastructure, instrumented before the first bolt-on closes. The playbook defines standard chart-of-accounts mapping, standard close schedules, and standard variance definitions across all entities in the platform. The incremental cost of onboarding the second and third acquisitions is minimal. The cost of retrofitting three separate reporting systems into one consolidated view is six months of finance capacity and a board that stops trusting the numbers halfway through.
If you are a sponsor running a buy-and-build strategy, the reporting layer is not a portfolio company problem. It is a sponsor decision that determines whether your platform thesis is executable or aspirational.
The Calendar That Drives Every Other Calendar
The board meeting is third Thursday of every month. The board pack is due the Friday before—twelve days from month-end. The portco finance team needs five days to close the books, three days to consolidate subsidiaries, two days for variance commentary, and two days for sponsor review. That is twelve days of sequential dependency before you add a single hour for data correction, accrual adjustments, or questions from the operating partner.
The calendar works when every system closes on time and nobody asks a question that requires drilling into source data. It fails the first time a subsidiary misses its close deadline, or a new acquisition introduces a different fiscal calendar, or the sponsor asks why professional services revenue dropped 8% when headcount was flat. The calendar is not the problem. The problem is that the calendar was drawn without acknowledging the cumulative fragility of twelve sequential handoffs, each of which depends on the previous step completing perfectly.
The operating partner who treats the board calendar as fixed and then tells the portfolio CFO to "figure it out" has created a system where speed and accuracy are structurally opposed. The CFO can deliver on time by skipping variance analysis, or deliver accurate numbers by missing the deadline. The calendar forces a choice that should not exist, and the choice gets made implicitly every month when the pack lands late or the variance commentary reads like placeholder text.
The fix is not telling finance to work faster. The fix is redesigning the calendar to reflect the actual duration of each step, then working backward from the board date to determine what needs to be true about close speed, consolidation automation, and data quality for the calendar to be achievable. If the math says you need a seven-day close and you currently run at fourteen, the value creation plan includes finance infrastructure investment, not a motivational speech about urgency.
If you are an operating partner defining the board calendar for a new platform investment, map the critical path first. Count the days from month-end to board pack, assign realistic durations to each step, and identify the constraint. The calendar that works is the one where the constraint has been solved, not the one where the constraint has been ignored.
What Good Looks Like
A portfolio company running a functional reporting layer closes its books in five business days, produces consolidated actuals with variance commentary in two additional days, and delivers the board pack nine days after month-end. The CFO can answer any line-item question by drilling into the underlying data without waiting for a subsidiary to respond. The operating partner trusts the numbers because the audit trail is instrumented, not because the CFO is credible.
The company got there by treating reporting infrastructure as a Day 1 investment, not a post-close optimization. It standardized the chart of accounts before the first bolt-on closed. It automated consolidation using a single ERP instance rather than stitching together three accounting systems with manual Excel bridges. It defined variance thresholds that trigger commentary, so the board pack explains the 8% revenue drop without the operating partner having to ask. The result is not perfection. It is a system where variance is visible, explainable, and actionable within the board cycle, rather than discovered in retrospect three months later.
The companies that do not get there make three predictable mistakes. First, they treat reporting as a finance problem rather than an infrastructure problem, so the CFO is accountable for outcomes they cannot control without engineering support. Second, they defer the standardization work until after integration is complete, so every bolt-on introduces a new mapping layer that makes consolidation slower and more fragile. Third, they optimize for the board pack as a deliverable rather than the reporting layer as a system, so the pack looks polished but the underlying data cannot answer follow-up questions without a two-week research project.
If you are a deal partner evaluating a target, diligence the reporting layer the same way you diligence revenue quality. Ask how long it takes to close the books. Ask whether subsidiaries are on the same chart of accounts. Ask whether the CFO can produce a variance waterfall by customer segment without going back to the accounting team. The answers tell you whether the platform thesis is executable or whether you are buying six months of post-close reporting infrastructure work that nobody priced into the model.
If you are an operating partner managing a portfolio company through its first year post-close, the reporting layer is the forcing function that determines whether the value creation plan survives contact with reality. Build it early, instrument it completely, and treat it as the system that makes every other operating improvement measurable.