A deal partner at a mid-market sponsor opens the Q2 board deck on Tuesday afternoon, two hours before the call. The file is 47 slides. Page six shows month-over-month revenue by product line, page twelve has a customer-acquisition funnel, page nineteen walks through headcount by department, and page twenty-seven displays the NPS trend. The partner closes the deck on slide four, screenshots the revenue bridge and the cash-flow waterfall, pastes both into the portfolio dashboard, and joins the call having read nothing else. The operator on the other end spent six days building that deck, and 43 slides went unread because the only question the sponsor brought to the meeting was whether the company is still on the path it underwrote.
Board reporting for private equity portfolio companies isolates the three or four numbers that map directly to enterprise value and surfaces them before anything else. Most portco decks fail that test because they are built in the operating partner's order, functional review first, and the deal partner's questions, exit readiness and cash, appear somewhere past slide thirty. The CFO, the operating partner, and the board do not share a definition of what constitutes a reportable event, and nobody writes down the reporting schema before the first deck goes out.
What a Deal Partner Opens the Deck to Find
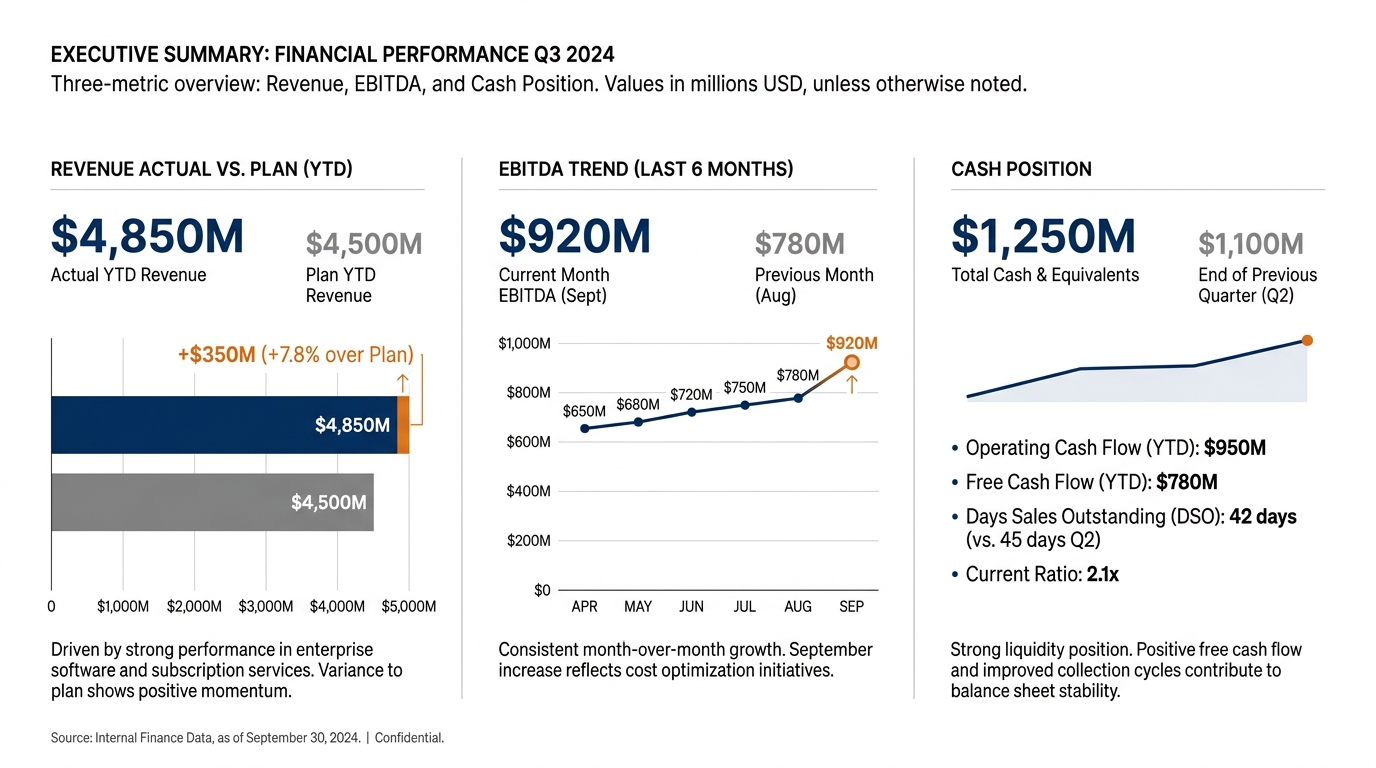
A sponsor is asking three questions in the first two minutes: is revenue on the plan we financed, is EBITDA improving or decelerating, and is cash sufficient to meet covenants and fund the next twelve months without another equity call. Every other metric in the deck, customer count, churn, product velocity, marketing spend, pipeline coverage, supports one of those three or explains a deviation. If the answer to all three is yes and the trend is stable, the partner skims the rest and moves to the next portfolio company. If any one of those three is off-plan, the entire call centers on the variance and the recovery timeline, and the deck's utility is whether it anticipated that question and brought the diagnosis forward.
The reporting layer that works starts with a one-page executive summary: revenue actuals against plan, EBITDA actuals against plan, cash on hand, debt service coverage, and days to covenant threshold if leverage is above 3.0x. Each figure carries three columns: this period actual, this period plan, and variance in both absolute dollars and percentage. That page alone tells the sponsor whether the company is on track. Everything after that is either the explanation for a material variance or the operating detail the CFO needs to manage the business.
Most decks invert that order. They open with a mission statement, a market-landscape slide, a customer-logo wall, and a product roadmap, none of which a deal partner at a $400 million fund has time to read. The revenue bridge appears on slide eighteen, after gross margin by segment and sales headcount by region, and cash flow is on slide thirty-four, after an IT spend breakdown and an office-lease renewal discussion. By the time the sponsor reaches the cash number, they have already formed a judgment about whether the operator understands what the board is there to govern, and that judgment is hard to reverse with a strong close.
Run-Rate vs. Forecast vs. Realized: The Classification a CFO Must Mark
A portco CFO reports Q2 EBITDA up 8% quarter-over-quarter and attributes the gain to three initiatives: a pricing increase that took effect in May, a reduction in cloud hosting costs after migrating two services off AWS, and improved gross margin on a new contract signed in March. The deal partner sees the 8% headline and assumes run-rate improvement. The operating partner reads the detail and realizes that one-third of the gain, the gross margin bump, came from a contract that ends in Q4 and does not renew, which makes it a realized one-time event rather than a structural lift. The other two-thirds, pricing and hosting, are run-rate if they持續 stick, but the deck does not say whether the pricing increase applies to the full base or only to renewals, and it does not say whether the hosting saving compounds as traffic grows or whether it was a one-time switch credit. Without that classification, the 8% figure overstates the operating improvement the sponsor can underwrite into the next financing round.
Every material variance in a board deck should carry a tag: realized, run-rate, forecast, enabled, or risk avoided. Realized means the value has already landed in the P&L and will not recur. Run-rate means the structural cost or revenue has changed and will persist at the new level. Forecast means the impact is modeled but not yet in actuals. Enabled means the capability is in place, revenue potential is there, but realization depends on execution or market timing. Risk avoided means the counterfactual, what would have happened without the action, and is only credible when the baseline was documented in advance. A CFO who marks every line with that classification gives the sponsor the ability to separate operating performance from accounting treatment, and the operating partner the ability to separate confidence from hope.
Where the Operating Partner and the CFO Diverge on What to Surface
An operating partner wants to see pipeline coverage, sales velocity, customer cohort retention, product adoption by feature, and marketing cost per lead because those are the levers the ops team pulls every week. A CFO wants to see revenue linearity, days sales outstanding, unbilled backlog, working capital, and vendor payment terms because those are the levers that determine whether the company can meet payroll in a down quarter without drawing on the revolver. A deal partner wants to see neither of those in detail unless one of them explains why revenue or EBITDA is off-plan. The reporting layer that works separates the operating review, which the portco leadership needs to run the business, from the board package, which the sponsor needs to confirm the investment thesis is still intact.
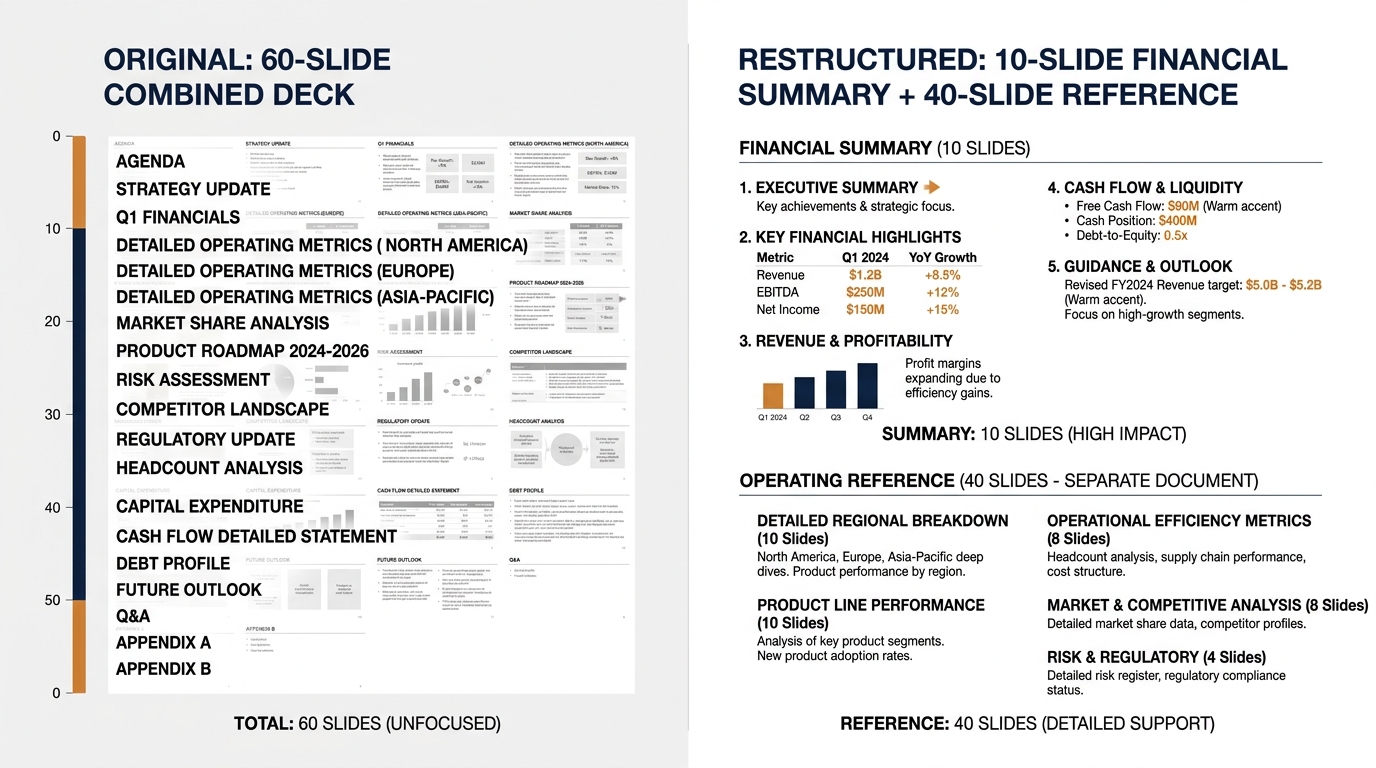
The practical split is a two-deck model. The operating partner prepares a functional review deck, typically 30 to 50 slides, that walks through sales, marketing, product, customer success, and operations in the level of detail the CEO and VP-level leaders need to diagnose friction and make decisions. The CFO prepares a financial deck, typically 8 to 12 slides, that starts with the executive summary and then moves through revenue detail, EBITDA bridge, cash flow, balance sheet, and covenant compliance. The board receives the financial deck in advance and the operating deck as a reference attachment. The call opens with the CFO presenting the financial summary, the sponsor asks clarifying questions, and then the operating partner walks through whichever functional sections the variance discussion flagged. If revenue is on plan and cash is strong, the operating review is a ten-minute update and the call ends early. If EBITDA is down, the operating review becomes a full diagnosis and the call runs over.
Most portcos combine both decks into one file and present them in sequence, which produces a 60-slide package where the sponsor's three questions are scattered across 12 different slides and the operator spends 40 minutes presenting material the board did not ask for. Experienced portfolio CEOs learn this after the first bad board call and split the decks before the second quarter. Newer CEOs spend six months wondering why the sponsor seems disengaged, and the answer is usually that the reporting cadence does not match the governance cadence.
The Schema Nobody Writes Down Until the Third Deck Fails
A portco closes its Series B in Q4 2023 and begins quarterly board reporting in Q1 2024. The CFO asks the sponsor what format they want, and the sponsor says 'whatever you normally prepare'. The CFO builds a deck modeled on the operating review the company used pre-transaction, which worked fine when the board was the founders and an angel investor but does not serve a deal partner managing 18 portfolio companies. The Q1 deck is 52 slides, revenue is on page fourteen, EBITDA is on page twenty-two, and cash flow is on page thirty-eight. The sponsor reads the first five slides, skips to the financials, screenshots three charts, and closes the file. The Q1 board call lasts 35 minutes, and the sponsor does not ask a single question about product, marketing, or customer success.
The CFO assumes the deck was fine because nobody complained, and Q2 follows the same format. The sponsor again skips to the financials, and this time revenue is 6% below plan. The variance explanation is on slide forty-one, buried in a sales pipeline discussion, and the CFO does not surface it in the executive summary because the operating partner framed it as a timing issue rather than a structural miss. The sponsor sees the 6% shortfall, does not see a diagnosis, and the call becomes a tense interrogation about whether the revenue plan is still achievable. The CFO realizes mid-call that the deck should have led with the revenue bridge and the recovery forecast, and after the meeting the sponsor sends a note asking for a revised reporting format going forward.
That revision is the reporting schema, and it should have been written before the first deck. The schema defines what goes in the executive summary, what order the financial detail follows, what variance threshold triggers a deep-dive explanation, and what operating metrics the board wants to see every quarter versus on request. A working schema for a $50M portco typically includes revenue and bookings actual vs. plan, EBITDA actual vs. plan with a bridge for any variance over 5%, cash and debt balances, DSO and DPO, monthly burn if EBITDA is negative, top five customers by revenue, and churn rate if the business is recurring. Everything else is appendix unless the sponsor specifically requests it. Strong portfolio operators negotiate that schema in the first 100 days and update it once a year as the business scales.
Covenant Headroom as a Reported Field, Not a Footnote
A $75M portco carries a $30M term loan with a maximum leverage covenant of 4.0x and a minimum fixed charge coverage ratio of 1.2x. Trailing twelve months EBITDA as of Q2 is $12.8M, which puts leverage at 2.34x, comfortably below the 4.0x cap. The CFO includes both figures in the debt schedule on slide eighteen but does not surface covenant headroom in the executive summary because the company is not close to a breach. Q3 EBITDA comes in 12% below plan due to a customer churn event, trailing EBITDA drops to $11.6M, and leverage moves to 2.59x. The company is still safe, but the trend is pointing toward the covenant, and the sponsor now wants to see a monthly forecast of how close the company will get if Q4 EBITDA also misses.
The CFO builds that forecast in response to the Q3 question, but the better practice is to report covenant headroom every quarter as a dedicated metric, not as a footnote in the debt table. Headroom is the difference between the current ratio and the covenant threshold, expressed in both absolute EBITDA dollars and in quarters of runway at the current burn rate. If leverage is 2.59x and the covenant is 4.0x, headroom is 1.41 turns, which at the current $11.6M EBITDA translates to $16.4M of allowable EBITDA decline before a breach. If EBITDA is falling $200K per quarter, that is twenty quarters of runway, and the covenant is not a near-term concern. If EBITDA is falling $1.2M per quarter, that is three quarters of runway, and the sponsor needs a mitigation plan now.
Most portco CFOs do not report headroom until the sponsor asks for it, which usually happens when headroom is already tight. The reporting layer that prevents that conversation is a dedicated covenant section in every board deck, immediately after the cash summary, that shows leverage, fixed charge coverage, and headroom in turns and in quarters. If headroom is above eight quarters, one line is sufficient. If headroom is below four quarters, the section expands to include a scenario analysis showing what happens if revenue or EBITDA miss by 10%, 15%, and 20%, and what operating levers the company can pull to stay in compliance.
What Gets Built Once and Never Updated
A CFO inherits a board deck template from the prior finance lead, built in Q1 2022 when the company was doing $18M in annual revenue with 60 employees. The template has sections for revenue by product line, gross margin by segment, sales and marketing spend, G&A spend, headcount, and cash. It worked well at that scale. By Q2 2024 the company is doing $52M annually with 140 employees, it has added two acquisitions, it operates in three countries, and it carries $25M in debt. The original template still governs the board deck, which means acquisition performance is buried in a footnote, international revenue is aggregated into a single 'other' line, and debt service is listed as a line item in cash flow without any discussion of covenants or refinancing risk.
The financial summary still answers the three core questions, so the sponsor does not ask for a better deck. The operating partner cannot use the deck to diagnose variances because the revenue and cost detail is too aggregated. The CFO knows the template is outdated but never rebuilds it because quarterly board prep is a six-day sprint and there is no time between quarters to redesign the structure. The deck technically complies with board reporting but does not serve the operating partner, the CFO, or the sponsor. Everyone tolerates it because replacing it feels like a bigger lift than continuing with the old version.
The forcing function that breaks that inertia is usually a bad quarter. Revenue misses by 10%, the sponsor asks for a revenue bridge by acquisition and by geography, and the CFO realizes the current template cannot produce that view without a full data pull from three different systems. At that point the CFO and the operating partner sit down and rebuild the reporting layer from scratch, which takes two weeks of focused work but produces a deck that actually maps to how the business is run. Operators who have been through a restructuring or a refinancing do that rebuild proactively, in Q4 of a clean year when there is time to test the new structure before the next financing event.
The Reporting Layer That Survives Diligence
A portco is eighteen months from a planned exit, and the sponsor brings in a sell-side advisor to begin positioning the business. The advisor's first request is three years of historical financial data in a standardized format: revenue by month, EBITDA by month, cash flow by month, customer count by month, churn by cohort, and sales efficiency by channel. The CFO pulls the board decks from the past twelve quarters and realizes that the revenue categorization changed three times, EBITDA bridge logic is inconsistent across quarters, and customer count was reported as total logos in 2023 but switched to active paying accounts in 2024 without a reconciliation. The advisor asks for a restatement, which takes the finance team four weeks and delays the diligence process by a full quarter.
The reporting layer that survives diligence is one where the schema is defined once, implemented in Q1, and held constant for at least two years. Revenue categories do not change unless there is an acquisition. EBITDA adjustments follow a documented policy that the auditor has reviewed. Customer definitions are written down and applied uniformly. Every board deck uses the same template, and every variance explanation follows the same structure. When the sell-side advisor asks for historical data, the CFO can export it directly from the board reporting system without manual reconciliation, and the diligence team has confidence that the numbers they are underwriting are consistent with what the sponsor has been seeing every quarter.
Most portcos do not design for that consistency because the exit is three to five years out and the immediate pressure is to close the current quarter. The CFO who treats board reporting as a diligence artifact from day one, rather than as a quarterly compliance exercise, builds a financial record that accelerates the exit process and reduces the risk of a valuation adjustment when inconsistencies surface late.
Conclusion
Board reporting for a PE portfolio company isolates the three or four metrics a deal partner needs to confirm the investment thesis is intact, surfaces them in the first two slides, and structures the rest of the deck so that any material variance comes with a diagnosis and a recovery timeline before the sponsor has to ask. The schema that works starts with revenue, EBITDA, and cash on page one, separates run-rate gains from one-time events, reports covenant headroom as a standing metric, and holds the format constant across quarters so that the financial record survives diligence without restatement.
The portco CFO who builds that layer in the first 100 days, rather than after the first bad board call, gives the sponsor confidence in the numbers and gives the operating partner the financial visibility to manage the business without waiting for the board to surface a problem.
DevriX's Sponsor Reporting Layer is built for PE-backed portfolio companies that need board-ready financial dashboards, covenant tracking, and variance reporting structured for sponsor and operating-partner consumption. If your board deck is 50 slides and your sponsor is reading four of them, the reporting schema is the fix. Start the conversation.
When the Board Deck Becomes the Diligence Record
The reporting layer a portco builds in year one is the financial record a buyer underwrites in year four. A sponsor holding a portfolio company for 48 months will produce 16 quarterly board decks. If the revenue categorization changes in quarter six, and the EBITDA bridge logic is revised in quarter ten, and the customer definition shifts in quarter thirteen, the sell-side advisor preparing the CIM will spend three weeks reconciling the historical presentation into a single consistent view, and the buyer's diligence team will discount the forecast because the record shows instability in how the business measures itself.
The CFO who designs the board reporting schema with diligence legibility as the constraint, not quarterly storytelling convenience, produces a financial record that needs no restatement when the process opens. Revenue categories are set in Q1 and held for the full hold period unless an acquisition forces a revision. EBITDA adjustments follow a written policy the auditor reviews annually. Customer counts use a single definition applied uniformly across every cohort and every quarter. Variance explanations follow a template, so a buyer reading 16 decks in sequence sees the same diagnostic structure every time and can assess management quality from the consistency of the format, not just the accuracy of the forecast.
Most portcos do not build for that outcome because the exit is three years out and the immediate need is to satisfy the current board meeting. The operator who treats the board deck as a diligence artifact from month one delivers a financial record that accelerates the exit timeline and eliminates the valuation risk that surfaces when a buyer finds inconsistencies the sponsor never flagged.