Board Reporting for Private Equity Portfolio Companies: Why the Sponsor Pack and the Operator's Dashboard Disagree
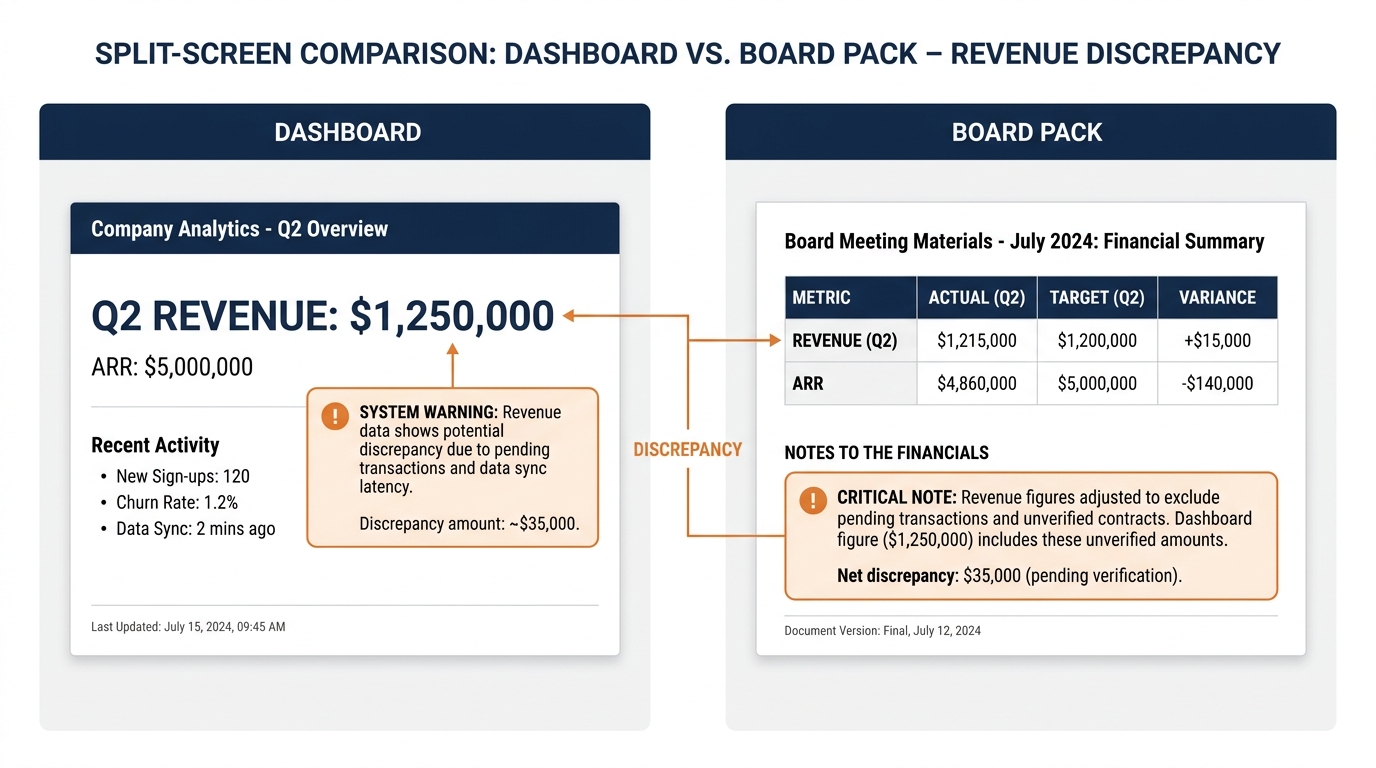
Three weeks after close, the deal partner pulls the first monthly board pack and sees October revenue at $4.2M. The portfolio CEO's operating dashboard, open in another browser tab, shows $4.7M for the same period. Nobody disputes either number came from the actual system. The reconciliation takes forty minutes of the board call, the CFO walks through three different revenue-recognition policies inherited from three acquisitions, and the partner leaves the meeting with no conviction on whether the portco is tracking to plan.
The problem is not bad data. It is two reporting paths pulling from different definitions, on different refresh cycles, with no shared source of truth. One feeds the sponsor, one feeds operations, and they drift because nobody built the layer underneath that keeps them aligned.
Why the Board Pack and the Dashboard Show Different Numbers
Most portfolio companies inherit multiple financial systems at acquisition. The target ran QuickBooks, the bolt-on brought NetSuite, and the integration plan said "we'll unify later." Revenue closes in one, expenses in another, cash reconciles manually in Excel. The operating team builds dashboards off live database queries because they need intraday visibility. Finance pulls the board pack from the ERP's month-end close, which locks three days after period-end and includes accruals the live queries do not capture.
By the time the sponsor sees the pack, the two views have diverged on:
- Revenue recognition timing. SaaS bookings hit the dashboard when the contract signs; GAAP revenue spreads across the term and shows up in the pack four weeks later.
- Expense allocation. Shared-services costs sit in a holding account in the ERP but post to operating units in real time on the dashboard, moving EBITDA by $140K between the two views.
- FX and intercompany. The European subsidiary reports in euros; the dashboard converts at spot rates, the pack uses monthly averages, and the two never reconcile cleanly.
- Cash vs. accrual. The CEO manages to cash because payroll clears on Fridays; the sponsor evaluates on accrual because the purchase agreement and the debt covenants both measure EBITDA that way.
None of this is hidden. The CFO knows why the numbers differ and can explain it in detail. The problem is that explanation happens in every board meeting, trust in the headline figure erodes, and the deal partner stops believing the forecast because the actuals keep moving.
What the Sponsor Actually Needs in the Board Pack
The board pack is not an operating report. It exists to let the deal partner and the operating partner evaluate whether the thesis is working, whether the value-creation plan is on track, and whether any risk requires intervention before it hits covenants or the next fundraise. That means the pack should show:
- Actual vs. plan variance, with commentary on the delta. If EBITDA is $320K under plan, the sponsor does not need five slides of department activity. They need to know whether it is timing, a pricing assumption that broke, or churn the model did not predict.
- Cash position and covenant headroom. Many portcos report net income and EBITDA but bury the cash-flow statement three tabs deep. The sponsor cares about liquidity and whether the revolver is about to breach. Lead with days of cash, debt service coverage, and how close the company is to any financial maintenance test.
- One revenue definition the whole organization uses. SaaS revenue, services revenue, product revenue — pick the recognition policy that matches how the business actually monetizes and apply it everywhere. If bookings matter more than GAAP revenue for managing the business, report bookings as the headline and reconcile to GAAP in a footnote.
- Pipeline coverage for the next two quarters. Revenue actuals are backward-looking. The deal partner wants to know whether Q1 is covered at 3x, whether any large renewal is at risk, and whether the pipeline build supports the exit-year forecast. Most packs bury this in an appendix or omit it entirely.
- Integration or value-creation milestones. If the plan said "migrate 60% of customers to the new pricing model by month six," the pack should show where that stands. Many portcos report financial outcomes but never connect them to the operational initiatives that were supposed to drive them.
What the pack should stop containing:活动 activity summaries no sponsor asked for, feature release lists, customer case studies, department org charts, and any metric that does not tie to value creation or downside risk. If a slide would not change a board decision, it does not belong in the deck.
The Reporting Layer That Keeps Both Views Aligned
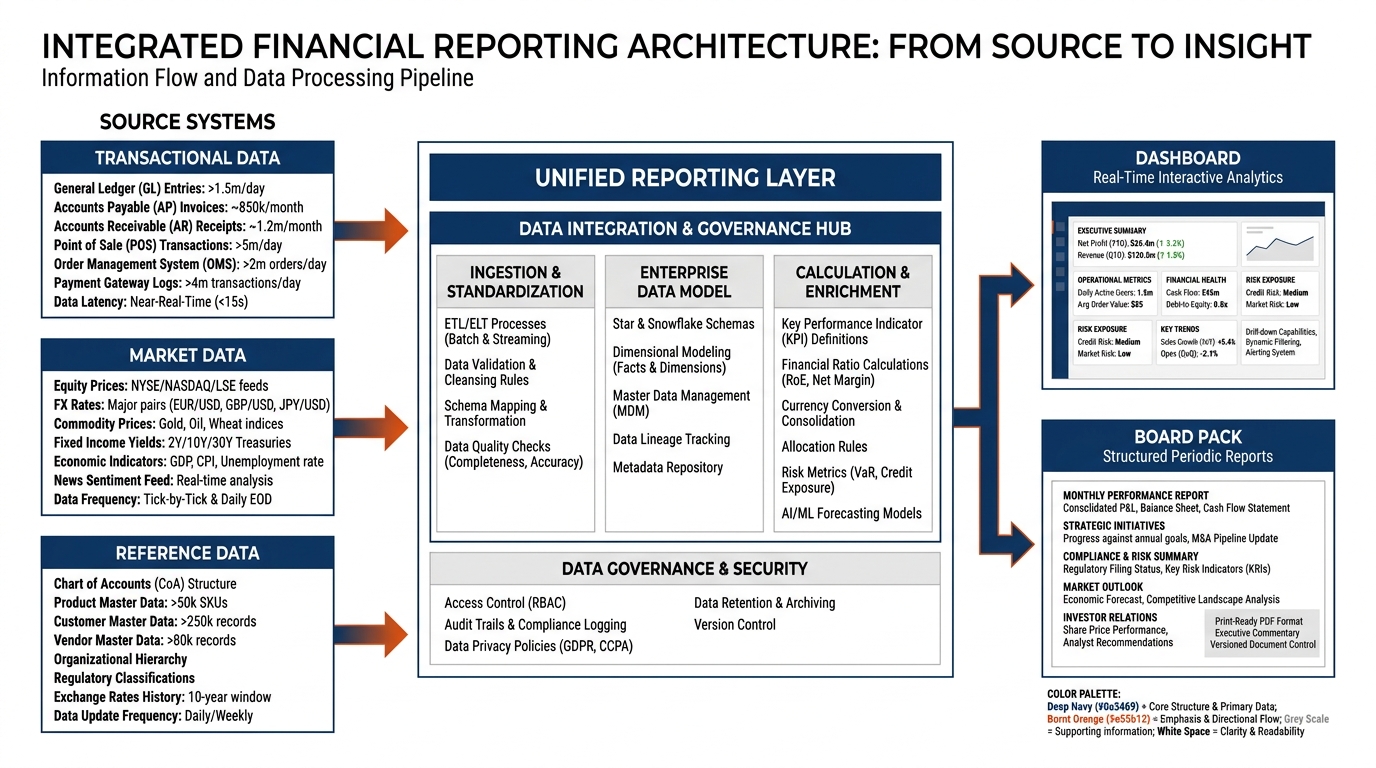
The fix is not better dashboards or cleaner board slides. It is a single reporting layer that defines revenue, EBITDA, cash, and variance once, applies that definition to every downstream view, and refreshes on a cadence the CFO can defend in diligence. Most middle-market portcos do not need a new ERP. They need one schema, one ETL pipeline, and one transformation layer that executive teams can actually trust when managing to a quarterly plan.
That layer sits between the source systems and the outputs. QuickBooks, NetSuite, Salesforce, Stripe, and the payroll provider all feed it. It applies a consistent chart of accounts, handles FX conversion at a single published rate, allocates shared costs the same way every period, and outputs to both the operational dashboard and the board pack from the same transformed tables. When the sponsor sees $4.2M and the CEO sees $4.2M, it is because both pulled from the same mart, not because someone manually matched them in Excel after the fact.
Most firms build this as a dbt project on top of a cloud warehouse, with scheduled refreshes and version-controlled transformation logic. The CFO defines the business rules once — how to recognize revenue, when to accrue an expense, how to handle intercompany eliminations — and the pipeline applies them uniformly. Changes to the rules get reviewed and merged like code, so there is an audit trail of what moved and why.
What Changes When You Build It
The immediate effect is that board meetings stop starting with reconciliation. The sponsor opens the pack, sees October revenue at $4.2M, checks the CEO's dashboard, sees the same number, and moves directly to whether the pipeline for Q1 is strong enough. That saves thirty minutes every meeting and rebuilds conviction in the forecast.
The second effect is faster closes. Most portcos take eight to twelve days to produce a board-ready financial pack because multiple people are pulling numbers from different systems, matching them manually, and writing variance commentary after the fact. A unified reporting layer cuts that to three days because the numbers refresh automatically and the CFO only writes commentary on the variances that matter.
The third effect shows up in the next transaction. When the portco goes back to market — for an add-on, a refinancing, or an exit — the buyer's QoE team asks for trailing-twelve revenue by month, cohort retention, and EBITDA build. If those all come from the same reporting layer the company has been using for two years, they match, they tie out, and the QoE does not flag data quality as a risk. If they come from three different Excel files someone stitched together during diligence prep, the buyer discounts the forecast and the valuation suffers.
The Reporting Cadence That Actually Works
Most portcos produce board packs monthly because the sponsor expects it, but few operating teams can do a full close, variance analysis, and commentary in five business days without cutting corners. The alternative is to split the calendar: a full board pack monthly, with actuals locked and variance explained, and a lighter operating pulse weekly or biweekly that shows cash, pipeline, and any alert that cannot wait thirty days.
The weekly pulse is not a deck. It is a two-page email or a Slack post: cash position, revenue booked week-to-date, any large deal that slipped, any expense that ran over, pipeline coverage for next quarter. It takes fifteen minutes to produce if the reporting layer is already running, and it keeps the operating partner and the CEO aligned between formal board meetings.
The monthly pack is the full variance story: actual vs. plan across revenue, EBITDA, cash flow, and any value-creation KPI the investment thesis depends on. It includes commentary on what moved, why it moved, whether it is structural or timing, and what action the team is taking. That level of rigor requires a real close, which is why companies that run distributed operations across multiple entities typically need seven to ten business days to produce it honestly.
Why This Breaks Down in Practice
The most common failure mode is that the portco builds the reporting layer, produces clean board packs for six months, and then the CFO leaves or the firm does an add-on acquisition. The replacement CFO does not understand the data model, the add-on brings its own chart of accounts, and within two quarters the pack and the dashboard are drifting again because nobody is maintaining the transformation logic.
The fix is to treat the reporting layer like production code: documented, version-controlled, with a clear owner who understands the schema and the business rules. When the CFO changes, the new hire should inherit runbooks that explain where every number comes from, how the allocations work, and what assumptions are baked into EBITDA. When an acquisition closes, the integration plan should include mapping the target's chart of accounts into the existing schema before the first combined board pack goes out.
The second common failure is that the operating team builds a beautiful dashboard, the sponsor never looks at it, and the board keeps asking for the same old pack format they have used for ten years. The dashboard dies from neglect, the pack stays manual, and nothing improves. The fix is to align upfront on what the sponsor actually reviews and where they want variance commentary. If the partner only reads three slides and skims the rest, stop producing the other forty and put the effort into automating the three that matter.
What to Build First
Start with one shared revenue definition and one cash view. Pick the recognition policy that reflects how the business actually monetizes — bookings for SaaS, revenue for services, shipments for product — and apply it uniformly across the dashboard, the pack, and the forecast model. Build the ETL that pulls bookings or revenue from the CRM and the billing system, applies the policy, and outputs a single number both views consume.
Then add cash. Pull bank balances, AP aging, AR aging, and payroll calendars into the same pipeline, compute days of cash and covenant headroom, and surface it in both the weekly pulse and the monthly pack. Cash is the metric that actually kills companies, and it is the one most portcos report least rigorously.
EBITDA comes third, after revenue and cash are stable. Build the expense allocations, the intercompany eliminations, and the adjustments the credit agreement requires, and version-control the logic so it does not drift when someone leaves. Once EBITDA is automated, layer in the value-creation KPIs — customer migration percentages, pricing realization, same-store sales, whatever the thesis depends on — and connect them to the financial outcomes they are supposed to drive.
The whole build typically takes six to ten weeks for a $50M-$200M portco with two or three operating entities and standard systems. The ongoing maintenance is two to four hours per month once the pipelines are stable. The return is that every board meeting starts with conviction in the number instead of thirty minutes reconciling why October shows up differently in two places.
When the Pack Finally Matches the Dashboard
The board pack and the operating dashboard will always serve different purposes. The pack is for governance, evaluation, and risk oversight. The dashboard is for daily operating decisions. But both should pull from the same source of truth, use the same revenue and cash definitions, and refresh on a cadence the CFO can defend when the QoE team shows up.
When that happens, the sponsor stops asking why the numbers moved and starts asking whether the plan is working. The operating partner can trace any variance back to a specific initiative or market event, not a reporting artifact. The CEO knows the dashboard they manage to every week will match the pack the board evaluates every month. And when the portco goes back to market, the data room has two years of clean financials that tie out on the first pass, because the reporting layer that produced them has been running in production the whole time.
If your board pack and operating dashboard show different revenue for the same month, you do not have a data problem — you have a reporting-layer problem. Growth Shuttle's Sponsor Reporting Layer builds the unified schema, ETL pipelines, and transformation logic that keeps both views aligned, cuts board-pack production time from ten days to three, and ensures the numbers your sponsor evaluates match the numbers your operating team manages to. Reach out at growthshuttle.com and we will walk through what a single reporting path looks like for your portco's systems and board cadence.
What Actually Breaks When the Views Diverge
The damage from mismatched reporting shows up in three places: the operating calendar, the sponsor relationship, and the exit process.
First, the operating calendar. When the board pack shows one October revenue figure and the dashboard shows another, the CFO spends the week before the board meeting reconciling instead of analyzing. The CEO cannot reference the operating metrics they managed to all quarter because those metrics do not match what the sponsor will see. The finance team pulls all-nighters rebuilding numbers that should already exist. And the operating partner who joined the call to discuss three value-creation initiatives spends forty minutes asking why bookings went up but revenue went down.
Second, the sponsor relationship. A deal partner who sees revenue move between the dashboard and the pack begins to discount both. They stop trusting the forecast because the actuals keep shifting. They escalate questions that should be routine because the data layer underneath feels unstable. And when the portco asks for growth capital or acquisition approval, the firm's internal investment committee wants a third reconciliation before they vote, because the track record has been inconsistent.
Third, the exit. A buyer's QoE team will pull two years of board packs, two years of management reports, and the CRM export, and they will compare all three. If revenue definitions drift, if cash balances do not tie to bank statements, if EBITDA adjustments are not documented, the process stalls. The buyer reprices for data risk, extends diligence, or walks. The delta between a clean exit and a repriced one is often the difference between a reporting layer that held up under scrutiny and one that broke on first contact.
The Fix Is Infrastructure, Not Discipline
Most portcos try to solve reporting divergence with process: more sign-offs, longer close calendars, reconciliation checklists. That works for a quarter, then breaks again when someone leaves or the business adds a new entity or the CRM changes its API.
The durable fix is infrastructure. Build the reporting layer once, version-control the transformation logic, automate the reconciliation checks, and run the same pipeline for both the dashboard and the pack. When revenue is computed in one place and consumed in two, the views cannot diverge. When cash is pulled from the bank API every morning and the pack references the same table, the CFO is not reconciling — they are analyzing.
That is the difference between a portco that reports and a portco that operates with data. One produces two versions of the truth every month and spends the close window reconciling. The other produces one version, validates it once, and uses the time saved to figure out whether the plan is working.
What the Unified Layer Actually Includes
A sponsor reporting layer that works is not a dashboard skin over existing systems. It is a schema, a set of pipelines, and a set of rules that sit between the source systems and every consumer — the board pack, the operating dashboard, the forecast model, and the QoE data room.
The schema defines revenue, cash, bookings, EBITDA, and every other metric the sponsor evaluates, in writing, with the calculation logic visible. It answers: what counts as revenue this month, which entities roll up, how refunds are treated, where FX conversion happens, what adjustments are standard, and what the baseline is. When the CRM calls something an opportunity and the ERP calls it a booking and the board pack calls it pipeline, the schema picks one term, maps the other two to it, and makes that mapping enforceable.
The pipelines pull data from Salesforce, NetSuite, HubSpot, Stripe, the bank, and any other system that holds a number the sponsor will ask about. They run daily, not monthly. They log every extract, transformation, and load step. They fail loudly when a source changes format or an API limit is hit. And they write to a single warehouse that both the dashboard and the pack query, so the two views are reading the same table at the same timestamp.
The rules validate the data before it reaches a report. They check that cash reconciles to the bank statement, that revenue by segment sums to total revenue, that October actuals match what was reported in the November pack, and that no metric moves between reports without a documented reason. When a rule breaks, the pipeline stops and the finance team fixes the source, not the output. The board pack does not go out with a number that failed validation.
The result is a portco where the October revenue figure is computed once, validated once, and referenced everywhere. The CEO's dashboard, the board pack, the forecast model, and the QoE data room all show the same number because they all query the same table. The CFO reconciles systems to the schema, not reports to each other. And when the sponsor asks why bookings moved, the answer is in the data, not buried in an Excel file someone built the night before the meeting.
Why This Matters More in Year Two Than in Year One
Most sponsors do not pressure-test the reporting layer in year one. The deal closed, the integration is running, the value-creation plan is on track, and the board meetings focus on the big moves — the pricing change, the sales-leader hire, the add-on acquisition. If the October revenue number is slightly different between the dashboard and the pack, nobody escalates it.
Year two is different. The integration is done, the easy EBITDA gains are captured, and the growth plan is now the operating plan. The sponsor wants to see whether the thesis is working, whether the forecast is reliable, and whether the portco is on track for the return case. They compare Q2 actuals to Q1 actuals, this year's margin to last year's margin, and the current run-rate to the exit model. And when those comparisons do not tie cleanly — when Q1 revenue was restated in Q2, when EBITDA adjustments are not consistent, when cash moved between line items — the deal partner stops trusting the data and starts asking for reconciliations instead of decisions.
That is when the cost of a weak reporting layer shows up. The portco that built the layer in year one is now running value-creation reviews with clean comps, stable definitions, and a forecast the sponsor believes. The portco that skipped it is spending board meetings explaining why the numbers moved, and the sponsor is discounting the outlook because the actuals keep shifting.
The time to build the layer is in the first six months post-close, when the integration workstream is still active and the data architecture is being re-wired anyway. Waiting until year two means rebuilding retrospectively, re-aging historical data, and trying to version-control definitions that have already drifted. It is fixable, but it is expensive, and it delays the value-creation plan while the finance team catches up.
What It Looks Like When It Works
A portco with a unified reporting layer closes the month in five days, not fifteen. The CFO spends close week validating assumptions and analyzing variances, not reconciling reports. The board pack is generated from the warehouse on day six, and the numbers in it match the numbers the operating team has been managing to all month. The CEO references the same October revenue figure in the board meeting that they referenced in the Monday operating review, because both are querying the same pipeline.
When the sponsor asks for a forecast sensitivity or a segment breakout, the finance team runs the query and sends it over, because the data is already structured and the definitions are already locked. When the operating partner wants to see whether the pricing change is working, they pull the dashboard, filter to the segment, and compare this quarter to last quarter, and the comparison is clean because the schema has not changed.
And when the exit process starts, the QoE team gets a data room where revenue reconciles, cash ties to the bank, EBITDA adjustments are documented, and the board packs match the management reports. The buyer does not reprice for data risk because there is no data risk. The diligence window does not extend because the finance team is not rebuilding numbers under pressure. And the portco exits at the multiple the sponsor modeled, because the reporting layer held up under scrutiny.
That is what the infrastructure buys: time, trust, and a clean exit. The portco that builds it early spends the hold period operating with data instead of reconciling it.