If I had to boil this down to one idea, it would be this: a retail forecast only works when I keep it simple, clean the data, and tie every number to a business choice.
For a U.S. SME, that usually means I forecast units and revenue for the next 7 days, 30 days, or quarter, then use that forecast for staffing, purchasing, and cash flow. I start with a plain baseline, adjust for things like seasonality, promotions, store-level events, and channel mix, and then check forecast error every week.
Here’s the short version:
- Sales forecasting estimates units sold and revenue.
- Demand forecasting looks at what customers want to buy.
- Inventory forecasting turns expected demand into ordering decisions.
- I need daily or weekly data, not just monthly totals.
- I should fix bad history caused by stockouts, returns, closures, and one-off bulk orders.
- I should begin with simple methods like last week, year-over-year checks, or a 4–8 week moving average.
- I should only add more modeling if it improves a decision that matters.
- I should forecast store, e-commerce, and pickup separately.
- I should review forecast vs. actuals weekly to spot bias.
A simple example: if I expect to sell 1,000 units at $125.00 each, my forecast revenue is $125,000. That one number can shape labor plans, buying plans, and near-term cash expectations.
What this guide says, in plain English, is that I do not need a fancy setup to forecast retail sales. I need a clear time horizon, clean inputs, documented adjustments, and a fixed review habit.
| Area | What I focus on | Why it matters |
|---|---|---|
| Scope | Time horizon, detail level, metric | Keeps the forecast tied to the decision |
| Data | POS, units, returns, stock, channel sales | Bad inputs lead to bad forecasts |
| Baseline | Last period, YoY, moving average | Gives me a starting point |
| Adjustments | Promotions, holidays, local events, weather | Stops me from treating unusual periods like normal ones |
| Use | Revenue, staffing, purchase orders | Turns forecast numbers into action |
| Review | Weekly forecast vs. actual | Helps me catch repeat misses |
That’s the whole playbook: define the forecast, clean the data, start simple, adjust with proof, and review on a schedule.
Business Forecasting Principles: 06. Forecasting in Retail
sbb-itb-c53a83b
Build a usable baseline from clean retail data
Before you choose a forecasting method, make sure the data going in is solid. For most SMEs, that means pulling from POS transactions, units sold, net sales, returns, cancellations, stockouts, inventory on hand, purchase orders, receipts, product IDs, and channel data. Track it daily or weekly instead of monthly. Monthly data is often too blunt. It can hide patterns you need to see.
It also helps to put one person in charge of checking data quality and reviewing forecast inputs. That single owner can catch bad entries, missing records, and odd swings before they throw off the baseline. Once the data is clean, you can compare methods on something you can actually trust.
Separate true demand from distorted sales history
Raw sales history rarely tells the whole story. It often falls short of true demand because sales get distorted by stockouts, one-time bulk orders, store closures, and other disruptions. If a product sold out in two days, that doesn't mean demand stopped. It usually means you ran out of inventory.
Flag those periods or adjust them before you build the baseline. Otherwise, you're training the forecast on bad signals.
Start with simple baselines before adding complexity
Start simple. Use last week or last month as the first reference point. Then layer in year-over-year comparison to account for seasonality. After that, use a 4–8 week moving average to smooth out noise.
To turn unit forecasts into revenue, use this formula:
Forecast Revenue = Forecast Units Sold × Expected Selling Price
Say you expect to sell 1,000 units of a product priced at $125.00. Your forecast revenue would be $125,000. It's a simple calculation, but it matters. It connects unit demand to a dollar amount your team can use for planning.
| Data Source | Forecasting Variable Supported | Common Data-Quality Risks |
|---|---|---|
| POS Transactions | Sales velocity & net revenue | Sync delays, missing timestamps |
| Units Sold | Demand volume | Failure to subtract returns/cancellations |
| Inventory on Hand | Stockout risk & safety buffers | Shrinkage, unrecorded damage, inaccurate counts |
| Returns/Cancellations | Net demand & true revenue | Processing lags, inconsistent reason codes |
| Channel Data (store/web/pickup) | Fulfillment mix & staffing | Misattribution between online and in-store sales |
| Purchase Orders/Receipts | Supply chain lead times | Incomplete records, shipping delays |
With a clean baseline in place, you can pick the method that matches your time horizon and the shape of your data.
Choose the right forecasting method for your retail operation
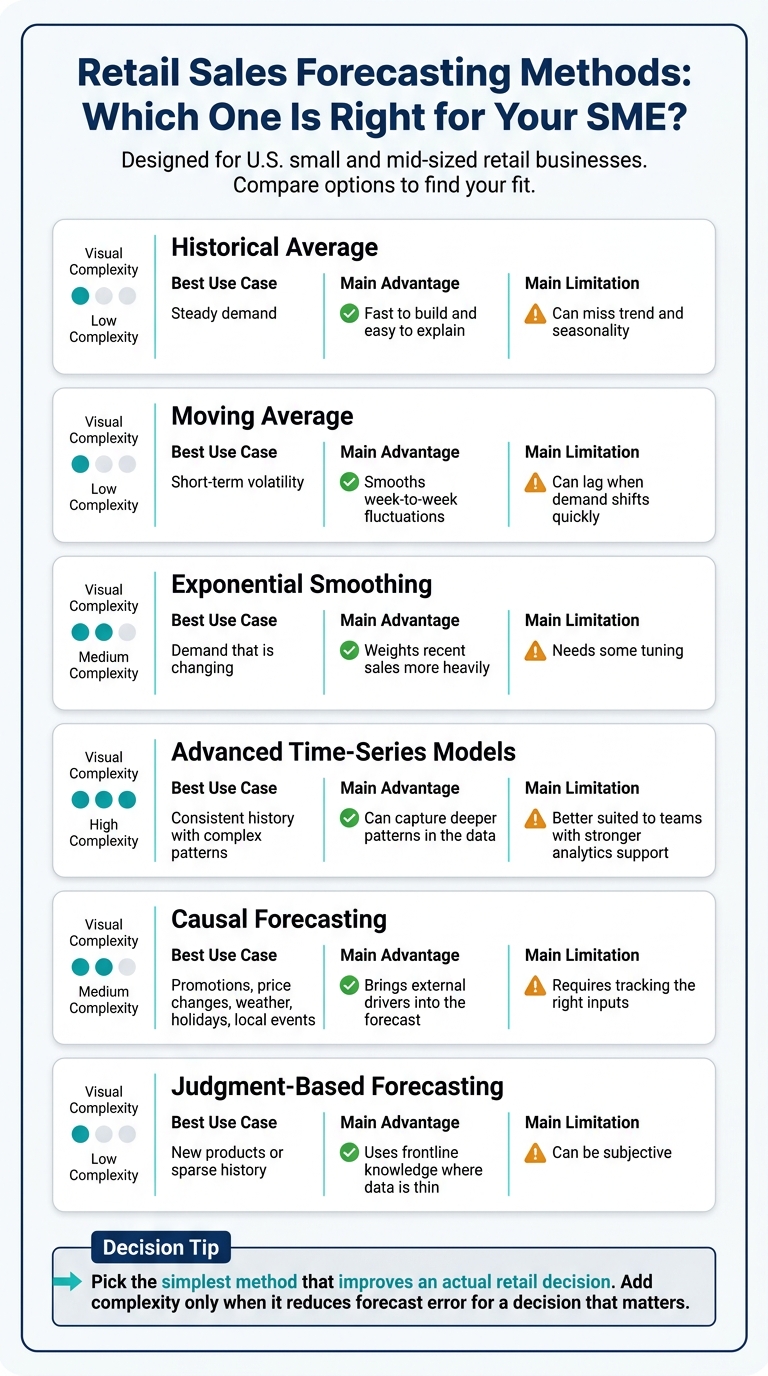
Retail Sales Forecasting Methods: Which One Is Right for Your SME?
Pick the simplest method that matches your data quality, forecast horizon, and your team’s ability to keep it running. That’s usually the smart move in retail. Once you’ve picked a base method, test it against the sales drivers that matter most.
Historical averages, moving averages, and smoothing methods
Use historical averages for stable SKUs. Use moving averages when sales are noisy from week to week. Use exponential smoothing when recent demand should count more than older sales history.
Time-series, causal, and judgment-based methods
Use time-series models only when you have clean historical data that shows trend or seasonality that simpler methods don’t pick up.
Retail demand is often pushed around by things like:
- price
- promotions
- holidays
- weather
- local events
Causal forecasting ties sales directly to those outside drivers. That means you can build them into the forecast on purpose instead of treating them like random noise.
Use judgment for new products, limited history, or one-off situations. In most cases, history should be the baseline, and judgment should be saved for clear exceptions.
How to compare forecasting methods before picking one
Before you commit to a method, check it against three practical filters: impact magnitude, time to value, and team capacity to maintain the forecast.
| Forecasting Method | Best Use Case | Main Advantage | Main Limitation |
|---|---|---|---|
| Historical Average | Steady demand | Fast to build and easy to explain | Can miss trend and seasonality |
| Moving Average | Short-term volatility | Smooths week-to-week fluctuations | Can lag when demand shifts quickly |
| Exponential Smoothing | Demand that is changing | Weights recent sales more heavily | Needs some tuning |
| More Advanced Time-Series Models | Consistent history with more complex patterns | Can capture deeper patterns in the data | Better suited to teams with stronger analytics support |
| Causal Forecasting | Promotions, price changes, weather, holidays, and local events | Brings external drivers into the forecast | Requires tracking the right inputs |
| Judgment-Based Forecasting | New products or sparse history | Uses frontline knowledge where data is thin | Can be subjective |
Pick the method that improves an actual retail decision. More complexity only makes sense when it cuts forecast error for a decision that matters.
That leads into the next step: adjusting forecasts for seasonality, promotions, local demand shifts, and channel mix.
Adjust forecasts for seasonality, promotions, local demand, and channel mix
Use documented changes only, and tie each one to a driver you can measure. Start with the baseline. Then adjust only when the driver is repeatable and you can track its impact.
Seasonality and promotion lift
Use the baseline to represent normal demand. Then layer in recurring calendar patterns and one-off events.
For promotion lift, compare sales from past promo periods against the baseline for the same SKUs during non-promo weeks. Keep track of the main promo details that shape lift, including:
- Discount depth
- Featured SKUs
- Promo dates
If a promotion changes when people buy, reflect that timing shift in the forecast. Don’t treat the promo week like ordinary demand if some of those sales were pulled forward or pushed out.
Local demand shifts and local conditions
Store demand can move for all kinds of local reasons: community events, school calendar dates, road work, access issues, changes to store hours, or severe weather. A simple store-level log goes a long way here. It gives you a record you can check when it’s time to rebuild the next forecast.
Those logs help surface store-specific changes that can get lost in a rolled-up number. Once you tag those effects at the store level, split your channel forecasts so they stay visible instead of getting buried in one blended total.
Forecasting by channel: store, e-commerce, and pickup
Don’t use one blended forecast across all channels. Forecast store, e-commerce, and BOPIS on their own, then roll them up.
That channel-level view shows where demand is actually coming from. It also helps you plan staffing and inventory with more accuracy, so blended demand doesn’t skew labor or stock decisions.
| Demand Driver | What to Capture | Forecast Treatment |
|---|---|---|
| Holiday seasonality | Historical weekly sales | Apply a seasonal adjustment to the baseline |
| Promotional discount | Discount depth, featured SKUs, promo dates | Estimate lift during the promotion and adjust the event window |
| Local event or school calendar | Store-level event log, school calendar dates | Make a location-specific adjustment at the store level |
| Road construction or access change | Store manager notes, traffic data | Adjust downward for affected periods |
| Channel mix shift (e.g., BOPIS growth) | Sales by channel, fulfillment data | Forecast each channel separately before rolling up |
| Severe weather | Weather impact history by store | Use scenario adjustments and add notes for the affected period |
Track the effect of each adjustment so the next forecast leans on the drivers that have had the biggest impact. Next, check those adjustments against forecast error and bias before using the numbers for staffing and purchasing.
Turn forecasts into revenue, staffing, and purchasing decisions
Once you’ve adjusted the baseline for seasonality, promotions, local demand, and channel mix, put it to work in day-to-day planning. The forecast shouldn’t sit in a spreadsheet. It should shape revenue targets, staffing levels, and purchase orders.
Measure forecast accuracy and review bias regularly
Track forecast vs. actual results on a set cadence. Then compare those numbers by store, product category, and channel.
If one location or category keeps landing above or below forecast, that usually signals a pattern in the assumptions, not random noise. That’s the kind of miss you want to pay attention to. Use those reviews to update the baseline, not just log the error.
Use forecast outputs in planning meetings
Build the sales baseline from sales transactions so you can see revenue and margin by segment and product line. That same baseline can also help you spot staffing limits early and keep schedules lined up with demand.
In each planning meeting, use the forecast to answer three plain questions:
- What revenue target is realistic?
- Where will labor be tight?
- How much should we order?
Review forecasts weekly.
Conclusion: start simple, document assumptions, and improve on a schedule
Once the forecast becomes part of the operating rhythm, keep the process simple. Define the forecast, clean the data, choose the simplest usable method, and document every adjustment.
Then layer in seasonality, promotions, local demand, and channel-level splits after you have a stable baseline.
From there, review forecast error on a fixed schedule. Treat systematic bias as a signal, not just a number. Consistent over- or under-forecasting points to a bad assumption.
FAQs
How much data do I need to start forecasting?
Ideally, collect 12 to 24 months of historical sales data. That gives you enough time to spot trends and seasonal patterns instead of guessing from a short window.
Keep the data clean and sorted by date. It also helps to adjust for things like promotions or price changes so your numbers reflect normal demand, not one-off spikes.
If your data is limited, you can still get started. Use simple quantitative methods, then layer in qualitative input, especially for new items or products with less predictable demand.
What should I do when stockouts distort past sales?
Treat stockouts as a data quality issue so they don’t distort your forecast. First, spot the gaps. Then decide whether missing values or outliers should be removed or estimated using other market signals.
Write down every change in a data dictionary. Also, work with sales, operations, and finance to add context around supply constraints or promotions that may explain the missing data.
How often should I update my retail forecast?
Retail sales forecasting isn’t a one-and-done job. It needs regular check-ins so your numbers stay on track as the market shifts.
A simple review rhythm looks like this:
- Monthly for short-term demand and day-to-day operating changes
- Quarterly to look at bigger sales patterns
- Annually for a full review across teams
It also helps to compare forecasted demand with actual sales. That’s how you spot gaps, fine-tune the model, and keep future forecasts closer to what happens in the store.