If you run or invest in a mid-market company, the secondaries market is not abstract. It is a real-time pricing signal that tells you how much liquidity exists in the private equity ecosystem, how stressed or confident LPs feel about their portfolios, and whether the NAV on your own cap table reflects anything close to clearing price. When secondaries volume spikes or discounts widen, that information travels upstream to affect your exit timing, your ability to raise follow-on capital, and the multiple a buyer will pay for your business.
This guide treats private equity secondaries as an intelligence input, not as a how-to for selling fund stakes. The goal is to help SME owners, operators, and advisors read secondaries data the way institutional investors do: as a leading indicator of where the liquidity cycle sits, what primary marks actually mean, and how to time portfolio decisions accordingly.
Secondaries volume as a read on the liquidity cycle
The secondaries market exists because private equity funds are illiquid by design. LPs commit capital for ten or more years. When they need liquidity before that horizon, or when GPs want to extend ownership of strong assets, secondary transactions provide an escape valve. The size and velocity of that escape valve tells you something important about the broader environment.
According to Jefferies' Global Secondary Market Review, secondaries volume reached $114 billion in 2023, up from $103 billion in 2022 and roughly $60 billion in 2020. That growth is not linear. It accelerates when liquidity stress rises and when GPs need creative structures to return capital to LPs who are overallocated.
For SME operators, this matters because secondaries volume is a proxy for how much pressure exists in the system. High volume combined with wide discounts signals that LPs are selling because they must, not because they want to. High volume combined with narrow discounts signals that buyers see value and are willing to pay close to NAV to access exposure. Each scenario has different implications for your own exit planning and for the multiples you can expect from sponsors.
When you track private equity market trends, secondaries volume belongs on your dashboard alongside fundraising totals, dry powder, and deal count. It is a lagging indicator of LP sentiment but a leading indicator of GP behavior.
What drives LP-led secondaries and what they tell you
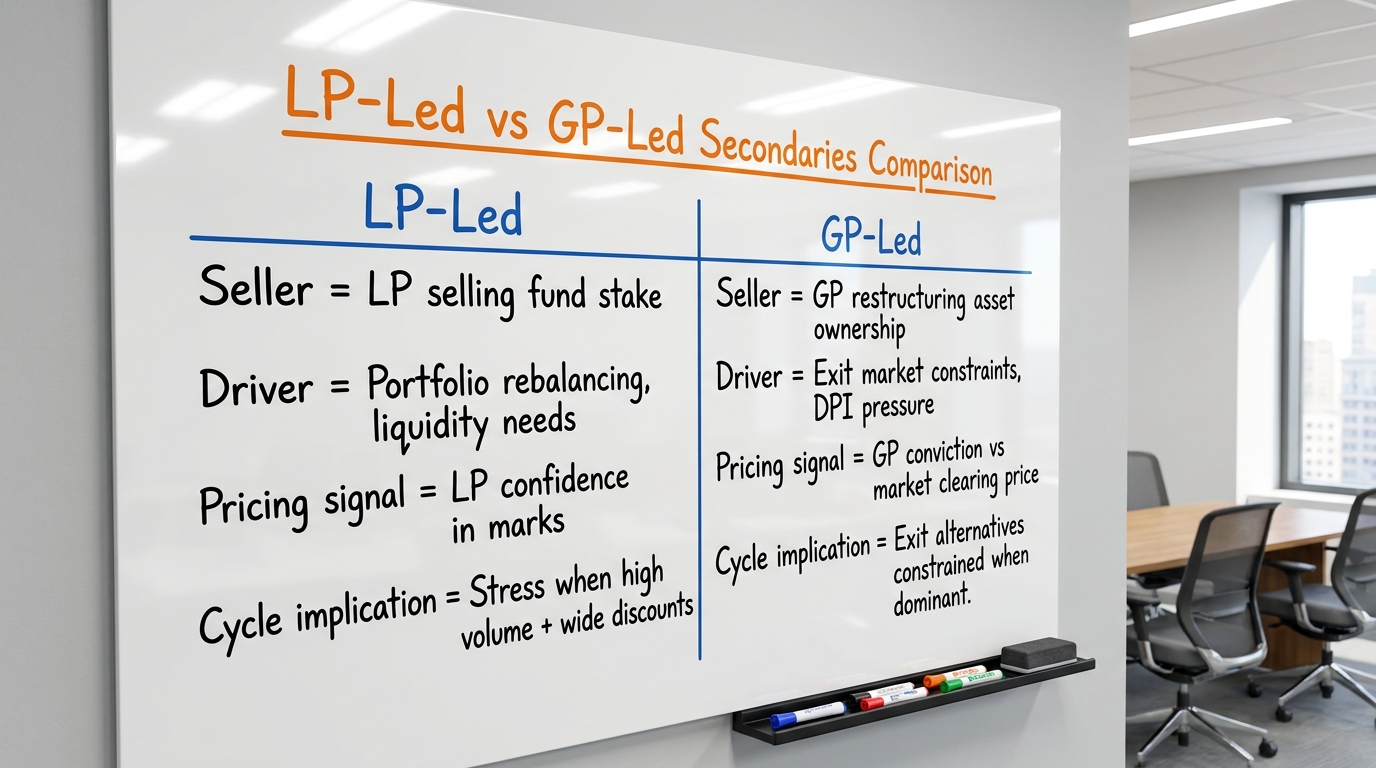
LP-led secondaries occur when a limited partner sells their fund interest to a secondary buyer. The original LP exits, the secondary buyer steps in, and the GP continues managing the fund. This is the traditional secondaries transaction and still accounts for roughly 40 to 50 percent of market volume, depending on the year.
Drivers of LP-Led Activity
LPs sell fund stakes for several reasons, and each reason carries a different signal:
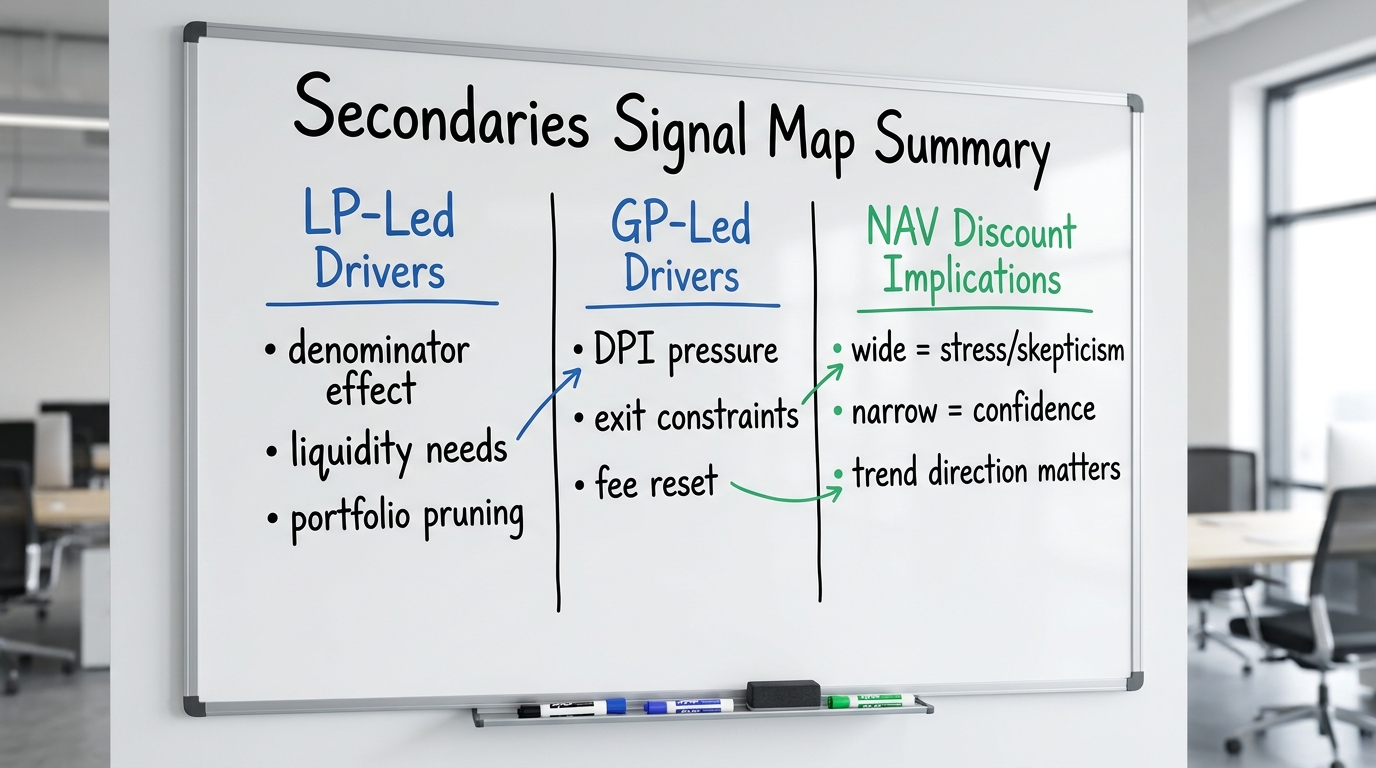
- Denominator effect: When public markets fall, private equity allocations rise as a percentage of total portfolio. LPs may breach allocation limits and need to sell PE exposure to rebalance. This driver surged in 2022 when public equities dropped sharply.
- Liquidity needs: Pensions, endowments, and sovereign funds sometimes need cash for distributions or operational reasons unrelated to PE performance.
- Portfolio pruning: LPs may exit relationships with underperforming GPs or funds outside their strategic focus.
- Regulatory or mandate changes: Some institutional investors face new rules that require reducing illiquid exposure.
When LP-led volume rises due to the denominator effect or forced liquidity, discounts to NAV tend to widen. Bain's Global Private Equity Report 2024 notes that average discounts on LP-led transactions reached 13 percent in 2023, compared to single-digit discounts in 2021 when liquidity was abundant.
What LP-Led Activity Tells You
A spike in LP-led secondaries with widening discounts is a stress signal. It means LPs are willing to accept a haircut to exit, which implies they either need the cash or have lost confidence in the fund's ability to deliver future returns at current marks. For an SME owner considering a PE-backed exit, this environment suggests that sponsors may face pressure to return capital and could be more aggressive buyers, but also that valuation discipline will be tighter.
Conversely, when LP-led activity is moderate and discounts are narrow, it suggests a healthy market where liquidity is available but not desperate. Buyers are competing for quality exposure, and sellers are not forced to transact.
What continuation vehicles reveal about exit market conditions
GP-led secondaries, particularly GP-led continuation vehicles, have grown from a niche structure to a dominant share of the market. In 2023, GP-led transactions represented over 50 percent of secondaries volume, according to Lazard's Secondary Market Report.
How GP-Led Transactions Work
In a GP-led secondary, the fund manager creates a new vehicle to hold one or more portfolio companies. Existing LPs can either roll their interest into the new vehicle or cash out by selling to a secondary buyer. The GP continues managing the asset, often with a reset economics package and an extended hold period.
Drivers of GP-Led Activity
GPs pursue continuation vehicles for several reasons:
- Conviction in the asset: The GP believes the company has more value creation runway but cannot hold it within the existing fund's timeline.
- DPI pressure: LPs are demanding distributions, and the GP needs to show realized returns without selling a strong asset at a suboptimal time.
- Exit market constraints: IPO windows are closed or strategic buyers are offering low multiples, making a continuation vehicle the best available option.
- Fee economics: Continuation vehicles allow GPs to reset management fees and carry on assets they already know well.
What GP-Led Activity Tells You
A surge in GP-led secondaries signals that the primary exit market is constrained. When IPOs are scarce and M&A multiples compress, GPs turn to continuation vehicles as a synthetic exit. This is not necessarily negative. It can reflect genuine conviction in portfolio companies. But it also means that marks on GP-led assets are set in a negotiated process, not in an open market auction.
For SME operators, high GP-led activity suggests that sponsors may prefer to hold quality assets rather than sell them into a weak market. If you are considering a sale to PE, this could mean longer hold periods and more focus on operational value creation rather than quick financial engineering.
What NAV discounts tell you about primary marks
The discount or premium to NAV at which secondary transactions clear is one of the most useful signals in the market. It tells you whether buyers believe GP marks are accurate, conservative, or inflated.
How Discounts Work
If a secondary buyer pays 90 cents on the dollar for an LP's fund stake, that implies a 10 percent discount to the GP's stated NAV. The buyer is either skeptical of the marks or demanding compensation for illiquidity and complexity. If the buyer pays par or a premium, they believe the assets are worth at least as much as the GP claims.
What Discounts Tell You About Primary Marks
According to EY's analysis of private equity trends, discounts widened significantly in 2022 and early 2023 as interest rates rose and public market comparables fell. This created a gap between GP marks, which are updated quarterly with a lag, and secondary market pricing, which reflects real-time buyer sentiment.
When discounts are wide, it suggests one of several things:
- Buyers believe GP marks have not caught up with market reality.
- Sellers are under pressure and willing to accept a haircut.
- Illiquidity risk is being priced more aggressively.
When discounts are narrow or premiums emerge, it suggests that buyers have confidence in GP marks or see upside that the marks do not fully capture.
Implications for Your Own Valuation
If your company is PE-backed, the NAV reported to you quarterly may not reflect what a secondary buyer would actually pay. Wide discounts in the secondaries market are a reminder that marks are estimates, not market prices. When planning an exit or evaluating your equity, secondary pricing provides a reality check on paper valuations.
For a deeper view on how fund performance shapes these dynamics, see the analysis of private equity fund performance benchmarks.
How a deeper secondaries market changes hold-period math
The growth of the secondaries market has structural effects on private equity economics. It changes the math for GPs, LPs, and portfolio company owners.
For GPs: Hold Periods Become More Flexible
Before the secondaries market matured, GPs faced pressure to exit within the fund's investment period, typically five to seven years. Now, continuation vehicles allow GPs to hold assets for ten years or longer. McKinsey's research on private markets notes that average hold periods have extended from roughly four years in 2010 to over six years today, with continuation vehicles enabling even longer ownership.
This flexibility changes how GPs approach value creation. They can invest in longer-cycle initiatives, such as geographic expansion, technology transformation, or talent upgrades, that would not pay off within a traditional fund timeline.
For LPs: Liquidity Options Improve
LPs now have more options to manage their portfolios actively. They can sell stakes in underperforming funds, prune GP relationships, or take liquidity from continuation vehicles. This reduces the all-or-nothing nature of PE commitments and allows more dynamic portfolio management.
For Portfolio Companies: Ownership Continuity Increases
SME owners who sell to PE-backed buyers may find that the sponsor holds the company through multiple fund structures. This can be positive, as it provides continuity and avoids disruptive flip sales, but it also means you should understand the sponsor's continuation vehicle strategy during due diligence.
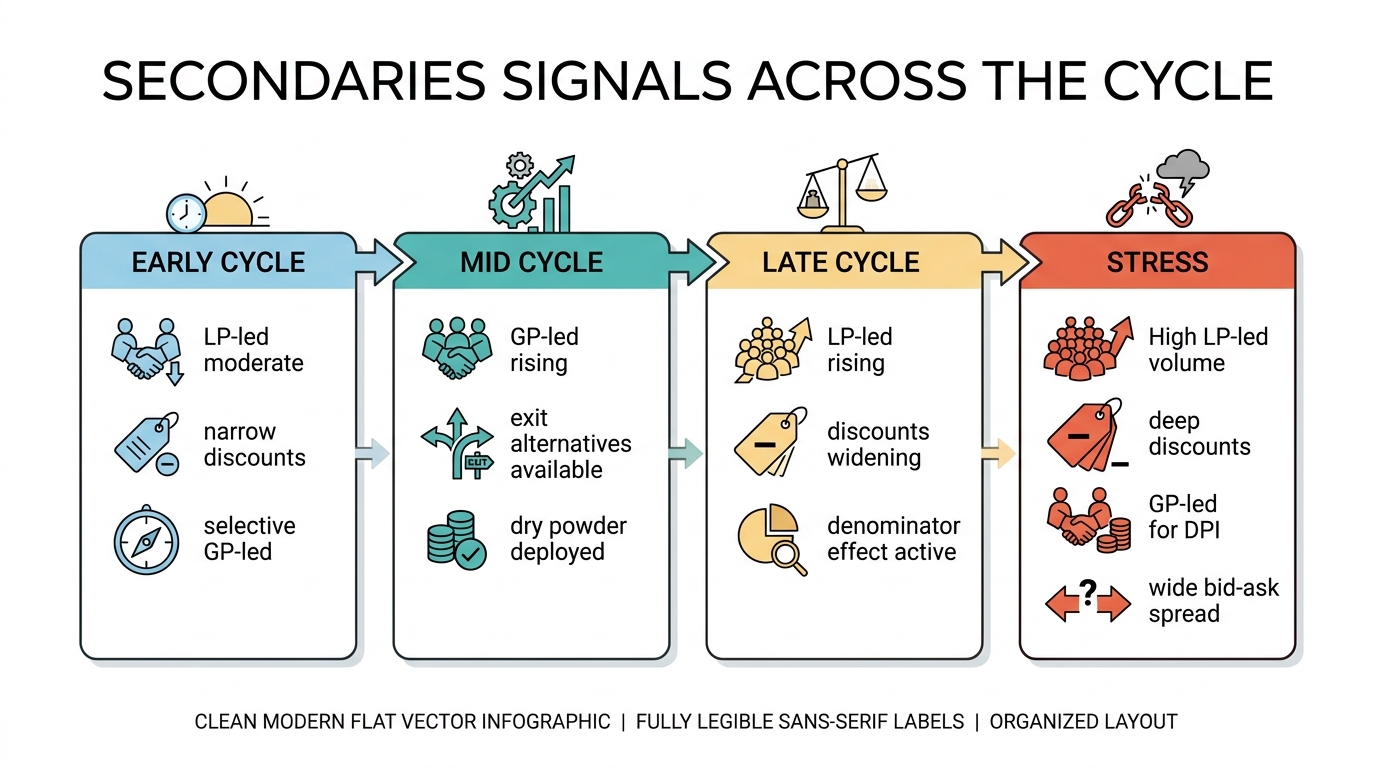
Signals to watch across the cycle
Secondaries data is most useful when you know what to track and how to interpret it in context. Here are the key signals and what they indicate at different points in the cycle.
Volume and Mix
Track total secondaries volume and the split between LP-led and GP-led. A shift toward GP-led dominance suggests exit market constraints. A spike in LP-led with wide discounts suggests portfolio stress.
Discount Levels by Strategy
Discounts vary by fund strategy. Buyout funds typically trade at narrower discounts than venture or growth funds, reflecting more predictable cash flows. Track discount levels over time and compare to historical averages. Widening discounts relative to history is a warning signal.
Dry Powder in Secondary Funds
Secondary buyers have raised substantial capital. Preqin data shows that secondary fund dry powder exceeded $200 billion in 2023. High dry powder means buyers are ready to absorb supply, which can support pricing. But it also means competition for quality assets is intense, which can narrow discounts even in stressed environments.
Bid-Ask Spread
The gap between what sellers want and what buyers offer is a measure of market health. A wide bid-ask spread suggests uncertainty about valuations. A narrow spread suggests price discovery is working.
LP Composition of Sellers
Pay attention to who is selling. When sophisticated LPs like large pensions and endowments are active sellers, it may reflect strategic portfolio decisions rather than distress. When smaller LPs or first-time allocators are selling, it may signal disappointment or liquidity pressure.
Distortions that make secondary pricing a poor proxy
Secondaries data is valuable, but it is not a perfect signal. Several distortions can make secondary pricing a misleading proxy for underlying asset values.
Selection Bias in LP-Led Sales
LPs do not sell fund interests randomly. They tend to sell stakes in funds where they have lost confidence or where they see limited upside. This means LP-led secondary pricing may be biased downward relative to the broader market. The best-performing funds rarely trade in the secondary market because LPs want to hold them.
Negotiated Pricing in GP-Led Transactions
GP-led continuation vehicles involve a fairness opinion and LP consent, but the pricing is negotiated between the GP and the secondary buyer, not set in an open auction. GPs have an incentive to achieve pricing that validates their marks. Secondary buyers have an incentive to get a deal. The resulting price may not reflect what the asset would fetch in a competitive M&A process.
Illiquidity Premium Variability
Secondary buyers demand different illiquidity premiums depending on their own fundraising and deployment timelines. A buyer with fresh capital may accept narrow discounts to deploy. A buyer nearing the end of their investment period may demand wider discounts. This variability means secondary prices can fluctuate based on buyer-side factors unrelated to asset quality.
Lag in Mark-to-Market
GP marks are updated quarterly with a lag. Secondary trades happen continuously. In fast-moving markets, secondary prices may reflect information that has not yet appeared in official NAVs. This can make discounts look artificially wide or narrow depending on the direction of market moves.
For these reasons, secondary pricing is best used as one input among several when assessing private equity market intelligence, not as a definitive answer on valuation.
Implications for exit timing and portfolio liquidity planning
Understanding secondaries dynamics helps SME owners and operators make better decisions about when and how to exit.
When Secondaries Signal Favorable Exit Conditions
Narrow discounts, moderate GP-led activity, and strong secondary fund dry powder suggest a healthy exit environment. Buyers are confident in marks, GPs have multiple exit alternatives, and liquidity is available. This is typically a good time to pursue a sale or consider a recapitalization.
When Secondaries Signal Caution
Wide discounts, surging LP-led activity, and dominant GP-led continuation vehicles suggest exit market stress. Primary buyers may offer lower multiples, and sponsors may prefer to hold rather than sell. If you can afford to wait, extending your timeline may be wise. If you must exit, expect tougher negotiations and more creative deal structures. A longer timeline is only worth taking if the extra quarters go into getting the business ready to be sold. Retention data that survives a buyer's own cohort analysis, a management team that can present without the founder, and revenue reporting that ties out take 2 to 3 quarters to build, and they are what closes the gap between a stressed multiple and a normal one.
Using Secondaries Data in Your Planning
Integrate secondaries signals into your private equity exit strategies framework. Track discount trends quarterly. Monitor the LP-led versus GP-led mix. Pay attention to commentary from secondary market participants, as their views on pricing and deal flow are leading indicators.
Liquidity Planning for PE-Backed Companies
If your company is already PE-backed, understand your sponsor's fund lifecycle and their likely use of continuation vehicles. Ask directly about their secondaries strategy. A sponsor who actively uses continuation vehicles may hold your company longer than the original fund term. This affects your own liquidity timeline and incentive structures.
Secondaries signal map: a usable reference table
The following table synthesizes the key signals from the secondaries market and their implications for SME operators and investors. Use it as a reference when interpreting market data.
| Signal Type | LP-Led Indicator | GP-Led Indicator | NAV Discount Read | Cycle Implication |
|---|---|---|---|---|
| High volume, narrow discounts | LPs actively managing portfolios, not distressed | GPs have conviction, exit alternatives exist | Marks are credible, buyers confident | Healthy mid-cycle, good exit window |
| High volume, wide discounts | Forced selling, denominator effect, liquidity needs | DPI pressure, exit markets constrained | Marks may be overstated, buyers skeptical | Late cycle or stress, caution on exits |
| Low volume, narrow discounts | LPs satisfied, holding exposure | GPs exiting through primary channels | Marks accurate, limited price discovery | Early cycle or recovery |
| Low volume, wide discounts | Few willing sellers even at discounts | GPs avoiding continuation vehicles | Bid-ask spread wide, uncertainty high | Market dislocation, limited liquidity |
| GP-led dominance (>50% of volume) | LP activity moderate | Exit markets closed, continuation preferred | GP-set pricing, less market validation | Extended hold periods likely |
| Discount widening trend | Increasing LP stress or skepticism | GP marks not keeping pace with reality | NAVs lagging market conditions | Expect valuation pressure on exits |
| Discount narrowing trend | LP confidence returning | GP marks validated by buyers | NAVs reflect or understate value | Exit environment improving |
Summary and checklist for using secondaries intelligence
Private equity secondaries are not just a liquidity mechanism for fund investors. They are a real-time signal about the health of the PE ecosystem, the credibility of valuations, and the likely behavior of sponsors. For SME owners and operators, this intelligence informs exit timing, negotiation strategy, and portfolio planning.
Key Takeaways
- Secondaries volume and mix reveal whether the liquidity cycle is healthy, stressed, or transitioning.
- LP-led activity with wide discounts signals portfolio stress and skepticism about marks.
- GP-led dominance signals constrained exit markets and extended hold periods.
- Discounts to NAV are a reality check on paper valuations, but selection bias and negotiated pricing limit their precision.
- A deeper secondaries market changes hold-period math and gives GPs more flexibility, which affects your ownership timeline.
Actionable Checklist
- Track total secondaries volume quarterly using reports from Jefferies, Lazard, or similar sources.
- Monitor the LP-led versus GP-led split and note shifts over time.
- Watch discount levels by fund strategy and compare to historical averages.
- Assess secondary fund dry powder as a measure of buyer capacity.
- Incorporate secondaries signals into your exit timing and valuation discussions.
- Ask your sponsor about their continuation vehicle strategy if you are PE-backed.
- Use the Secondaries Signal Map table as a reference when interpreting market data.
Secondaries data belongs alongside fundraising trends, deal multiples, and public market comparables in your toolkit for understanding where the PE cycle sits and what it means for your business.
Subscribe to the Growth Shuttle research briefing for the liquidity-and-secondaries briefing, and download the Secondaries Signal Map.