I use five help desk metrics together - not speed alone - to assess team productivity. My starting point: pair handle time with reopen rate to check quality, and resolution rate with backlog age to see whether work is getting cleared.
Quick Comparison
| Metric | What I check | What it can miss |
|---|---|---|
| First response time | How long customers wait for a useful human reply | Whether the issue gets solved |
| Average handle time | Active work spent per ticket | Whether faster work skips needed steps |
| Reopen rate | How often the same issue returns after resolution | Why the fix failed |
| Backlog age | How long unresolved tickets have been open | Whether agents control the delay |
| Resolution rate | The percentage of eligible tickets resolved | Whether closures reflect solved problems |
I compare tickets with similar priorities, channels, and complexity using the same definitions and reporting periods. For example, resolving 80 of 100 tickets in a fixed group gives an 80% resolution rate - but I still check reopenings and older work before judging the result.
My rule: <u>check the tickets before judging the agent</u>. Then choose coaching, staffing, routing, or a product fix, assign an owner and due date, and measure the same ticket groups again.
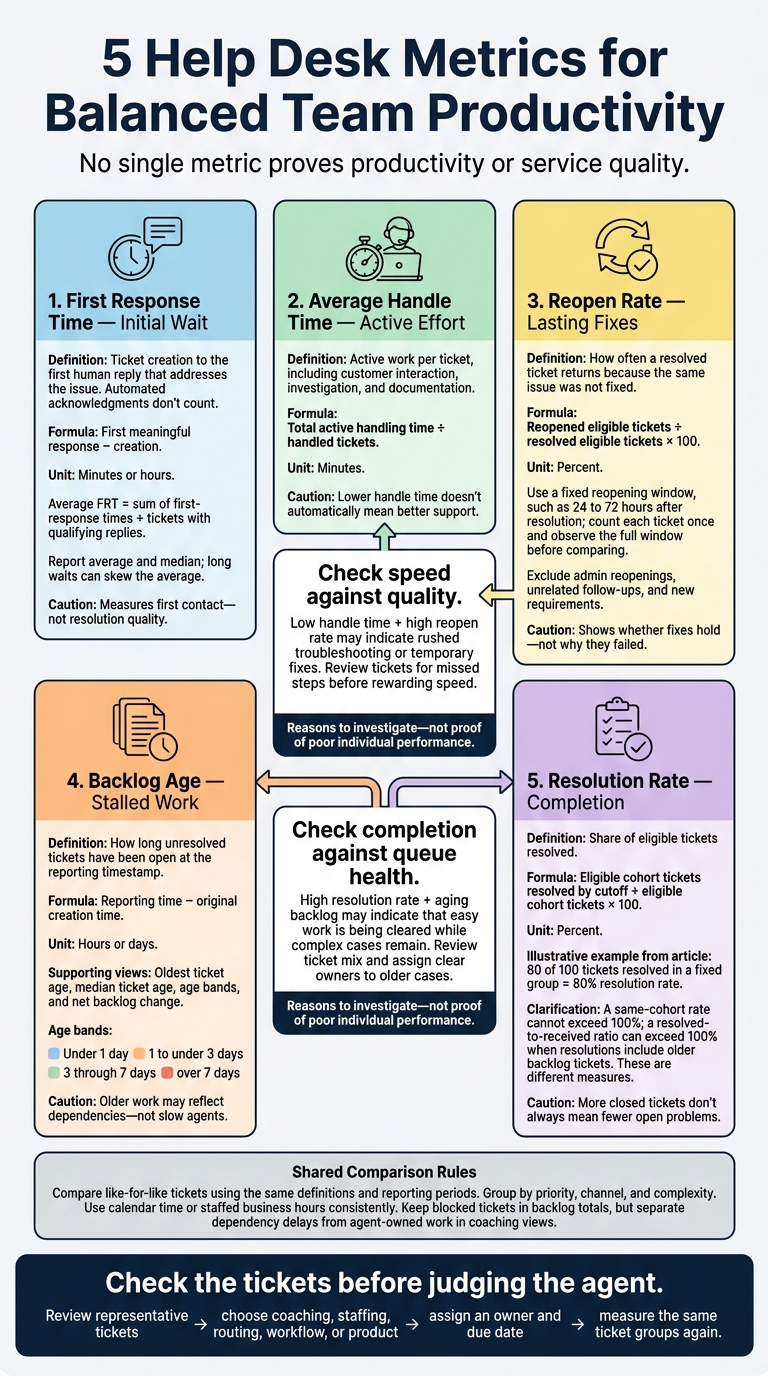
5 Help Desk Metrics for Balanced Team Productivity
1. First Response Time
What It Measures
First response time (FRT) tracks how long a customer waits between ticket creation and the first human reply that addresses the issue. Automated acknowledgments don’t count.
| Metric | What the clock measures | What it reveals |
|---|---|---|
| First response time | Ticket creation to the first qualifying human reply | Initial waiting time |
| Active handling time | Time an agent actively spends working on the ticket | Agent effort |
| Elapsed resolution time | Ticket creation to final resolution, including waits | Total time to resolution |
How to Calculate and Segment It
For each ticket, subtract the creation timestamp from the first qualifying reply timestamp.
Average FRT = sum of first-response times ÷ tickets with qualifying replies.
Median FRT is the middle ticket-level response time after sorting the times. Report both: long waits can skew the average, while the median shows the typical wait.
Compare tickets within priority, channel, and ticket type. Don’t lump urgent incidents together with routine requests. State whether you’re counting calendar time or staffed business hours, and use that same clock to check SLA compliance.
Risks of Optimizing It Alone
A shorter FRT improves the customer’s first impression, but fast replies can mask poor triage. FRT measures the first contact - not its quality. Don’t chase shorter times with rushed, incomplete replies. The first response should answer the immediate question or give the customer a clear next step.
How to Use It in Coaching
Help agents respond sooner without cutting corners: use triage rules, route tickets to the right owner, and set SLA alerts before deadlines.
sbb-itb-c53a83b
Free Service Desk Training Series | Unleashing the Enormous Power of Service Desk KPIs | MetricNet
2. Average Handle Time
Response speed tells you how quickly support responds. Handle time shows how much work each ticket takes.
What It Measures
Average handle time (AHT) measures active work per ticket, including customer interaction, investigation, and documentation. It shows how much team capacity each ticket uses.
How to Calculate and Segment It
Define what counts as active work, then use the same start/stop rules for every agent. Compare tickets within the same category, priority, channel, and escalation status.
Check outliers for data errors or complex cases. Compare like-for-like ticket groups so differences in ticket type don’t skew your assessment.
Risks of Optimizing It Alone
Lower handle time doesn’t automatically mean better support. Track AHT alongside reopen rate and resolution rate to spot when faster work comes at the expense of quality.
How to Use It in Coaching
If AHT falls but reopen rate rises, check diagnosis and resolution quality before rewarding speed. If AHT rises while resolution rate falls, look for process blockers, integration gaps, or product complexity.
Focus coaching on reducing manual steps and improving workflow handoffs. Give each change an owner and a due date, then check the metrics again to see whether it helped. Reopen rate shows whether faster handling holds up in production.
3. Reopen Rate
What It Measures
AHT shows how much effort a ticket takes. Reopen rate shows whether that effort solved the problem. It measures how often a resolved ticket returns because the fix didn’t hold. That distinction separates closed tickets from solved problems - and shows the cost of fast but unfinished support. Every reopened ticket uses support capacity twice.
How to Calculate and Segment It
Reopen rate = (reopened eligible tickets ÷ resolved eligible tickets) × 100.
Use resolved tickets with a fixed reopening window, such as 24 to 72 hours after resolution. Count each ticket once, even if it reopens multiple times. Wait until the window ends before comparing results.
Segment results by ticket type. Exclude admin reopenings, unrelated follow-ups, and new requirements so the metric tracks failed resolutions, not legitimate customer responses or new issues.
Risks of Optimizing It Alone
Apply consistent closure criteria so agents can’t improve the number simply by delaying closure. Read reopen rate alongside AHT and resolution rate. Review the reopened tickets before attributing the problem to an individual agent’s performance.
How to Use It in Coaching
Check failed resolutions for gaps in diagnosis, verification, communication, and closure notes, then build closure standards around those checks.
If the same patterns appear across agents, fix the shared workflows behind bugs, handoff gaps, or unclear expectations rather than penalizing individuals. High reopen rates also send work back into the queue and increase backlog age.
4. Backlog Age
When reopen rates climb, unresolved work ages faster.
What It Measures
Backlog age measures how long unresolved tickets have been open at the reporting timestamp. It shows where work is stalling - not who’s at fault.
Unlike first response time and handle time, backlog age tracks queue health rather than agent speed. It helps managers see whether capacity, routing, or dependencies are slowing work down. Older tickets may point to product bugs, complex features, or unresolved dependencies - not just slow agents.
| Measure | What It Reveals | Management Use |
|---|---|---|
| Oldest ticket age | Age of the longest-open ticket | Find stuck work that may need escalation. |
| Median ticket age | Middle age across unresolved tickets | Track typical waiting time without outliers. |
| Age bands | Ticket counts and shares within age ranges | Find clusters of aging work. |
| Net backlog change | Net change in unresolved ticket count | Check whether incoming demand exceeds completions. |
How to Calculate and Segment It
Calculate ticket age as reporting time minus creation time. Group tickets into nonoverlapping bands: under 1 day, 1 to under 3 days, 3 through 7 days, and over 7 days.
Calculate closing backlog as opening backlog + new tickets − resolved tickets, adjusting for reopenings, transfers, and approved exclusions. Then subtract opening backlog to get net backlog change.
Segment tickets by priority, category, assignee, dependency, and status. Keep blocked tickets in the backlog total, but leave them out of agent-only coaching views.
Risks of Optimizing It Alone
Low backlog age can hide premature closures. A high median age can also coexist with strong resolution when the team clears easy tickets first. Read the metric alongside queue mix and ticket status.
Set clear entry and exit rules for blocked statuses so moving work to “Pending” can’t hide delays.
How to Use It in Coaching
Review aging tickets by assignee each month. Separate agent-owned work from customer waits and development blockers. Coach prioritization when agents control the next step, and assign clear ownership for blocked tickets.
Set cross-department SLAs for older work. Route recurring product issues to engineering to reduce repeat demand. Pair backlog age with resolution rate during these reviews to check whether the queue is shrinking or just getting older.
5. Resolution Rate
Backlog age tells you whether the queue is getting older. Resolution rate tells you whether tickets are getting cleared.
What It Measures
Resolution rate measures the share of eligible tickets that get resolved. Pair it with first-contact resolution and resolution time to distinguish overall completion, success in a single interaction, and speed.
| Metric | What It Measures | Calculation |
|---|---|---|
| Resolution rate | Share of eligible tickets resolved | Resolved tickets ÷ eligible tickets × 100 |
| First-contact resolution (FCR) | Share of resolved tickets solved in one interaction | Tickets resolved on first contact ÷ total resolved tickets × 100 |
| Resolution time | Average time from creation to final closure | Total time to resolve ÷ resolved tickets |
How to Calculate and Segment It
Use (resolved tickets ÷ eligible tickets) × 100. Before comparing teams, agree on what counts as “resolved” and “eligible,” and define your denominator:
- Received: Newly opened tickets.
- Closure-eligible: Tickets that can legitimately close, excluding those blocked by third parties.
For a population-based rate, count only resolutions from that ticket population.
A same-cohort rate follows a fixed group of tickets and reports the share resolved by a set cutoff date. It cannot exceed 100%.
For example, track tickets received during one week.
A resolved-to-received ratio compares all resolutions in a period with new arrivals in that period. It can exceed 100% if those resolutions include older backlog tickets. Label the two measures separately.
Break down results by inbound versus outbound work and by customer segment. Otherwise, differences in workload can skew team comparisons.
Risks of Optimizing It Alone
A high rate can reward closing tickets too soon. Check it alongside reopen rate, backlog age, and customer feedback. More closed tickets don't always mean fewer open problems.
Review tickets to confirm that the recorded resolution addressed the issue.
How to Use It in Coaching
In monthly reviews, pair resolution rate with reopen rate and inspect the tickets behind any changes. Use cohort data to spot shifts in quality over time.
Separate coaching needs from product defects. Record each corrective action with an owner and a due date.
How the Metrics Compare
Each metric answers a different management question. The tables below show what each one measures - and where it falls short.
What Each Metric Measures
No single metric proves productivity or service quality. Read them together before deciding whether to coach agents, add capacity, or change a workflow.
| Metric | Primary Management Question | What It Cannot Prove Alone |
|---|---|---|
| First response time | How fast does the customer get a first meaningful reply? | Resolution quality |
| Average handle time | How much active work does each ticket take? | Efficiency or thoroughness |
| Reopen rate | How often does the same issue return? | Why resolutions failed |
| Backlog age | How old is unresolved work? | Whether the team controls the delays |
| Resolution rate | What share of eligible work gets completed? | Whether difficult cases get enough attention |
Calculation Rules and Ticket Segments
Start with shared definitions. Creation means queue entry; response means the first reply that addresses the issue; handling means active work; resolution means the issue is solved; and closure means the final ticket status. Apply these definitions across every metric to keep comparisons valid.
Count a reopen only when the same issue returns within the defined window. For elapsed-time measures, use either business hours or calendar hours consistently.
| Metric | Formula and Unit | Eligible Tickets and Useful Segments |
|---|---|---|
| First response time | First meaningful response − creation; minutes or hours | Valid incoming tickets; channel, priority, coverage schedule |
| Average handle time | Total active handling time ÷ handled tickets; minutes | Tickets with recorded work; complexity, feature, escalation path |
| Reopen rate | Resolved tickets reopened within the defined window ÷ resolved tickets observed for that full window × 100; percent | Fully observed resolution cohorts; issue type, feature, resolution method |
| Backlog age | Snapshot time − original creation time; hours or days | All unresolved tickets; priority, owner, dependency |
| Resolution rate | Eligible cohort tickets resolved by cutoff ÷ eligible cohort tickets × 100; percent | Fixed ticket cohort; complexity, channel, customer segment |
Compare similar workloads, priorities, channels, escalation paths, and schedules. Break results down by feature to spot product complexity or bugs that team averages can hide. Wait until the full closure and reopen window has passed before comparing results. Recheck definitions after routing, workflow, or system changes.
Risks of Optimizing One Metric Alone
| Metric | Risk When Optimized Alone | Safeguard |
|---|---|---|
| First response time | Empty or templated acknowledgments stop the clock without helping the customer. | Sample replies for useful next steps; check customer feedback |
| Average handle time | Agents rush troubleshooting and skip important steps. | Review diagnostic steps alongside reopen rate |
| Reopen rate | Agents may pressure customers not to reopen tickets or mark tickets resolved too early. | Audit ticket samples and use fully observed cohorts |
| Backlog age | Teams may cherry-pick easy new tickets while older, complex issues sit unresolved. | Inspect age bands and preserve original creation dates |
| Resolution rate | Administrative closures inflate apparent volume. | Separate cleanup from genuine resolutions; track blockers |
Before judging performance, audit ticket samples and check dependency status.
Using Metric Pairs in Coaching
Pair metrics to help separate speed problems from quality problems.
| Observed Pattern | Possible Explanations | Coaching or Process Action |
|---|---|---|
| Fast responses + slow resolution | Prompt replies but weak diagnosis or a blocked escalation path | Review troubleshooting and handoff history; address the skill gap or escalation delay |
| Low handle time + high reopen rate | Rushed tickets or band-aid fixes instead of root-cause resolution | Coach on thoroughness; review tickets for missed steps |
| High resolution rate + aging backlog | Easy work gets cleared while complex cases remain | Review ticket mix; assign clear owners to older, difficult cases |
| Aging backlog + low resolution rate | Possible understaffing, missing tools, or a surge in complex issues | Check staffing levels and how well tools work before blaming individual speed |
| Slow responses + normal handle time | High workload or ticket volume, or cherry-picking | Check total ticket volume per agent and routing rules |
Treat these patterns as reasons to investigate, not proof of poor individual performance. Review representative tickets before choosing a training, routing, staffing, tooling, or dependency fix. After the change, check the same segments again.
Choosing Metrics for Management Decisions
After comparing the metrics, use them to decide where managers should act.
Choose metrics based on the decision you need to make.
| Metric | Primary question | Best segment | What it helps answer | Risk if optimized alone | Coaching response |
|---|---|---|---|---|---|
| First response time | How long do customers wait for the first useful human reply? | Priority / channel | Whether initial waits need attention | Empty replies that stop the clock | Check that first replies help the customer |
| Average handle time | How much active work time does a ticket require? | Ticket category / complexity | Where capacity or training needs attention | Rushed customers or incomplete solutions | Use for capacity planning; review long-duration outliers for coaching |
| Reopen rate | Was the issue solved the first time? | Root cause / product area | Whether solutions hold up | Agents may discourage follow-up or delay closure | Review reopened tickets to identify root causes |
| Backlog age | How long have unresolved tickets been sitting in the queue? | Ticket status / assignee | Where bottlenecks and complex issues stall work | Ignoring new tickets to clear old ones, or vice versa | Use trends to identify why specific tickets stall |
| Resolution rate | What share of eligible tickets gets resolved? | Ticket cohort / team | Whether eligible work gets completed | Premature closures that inflate the rate | Review representative completed tickets for premature closures |
The table points to the problem. Ticket reviews help you choose the fix: coaching for repeated skill gaps, a staffing review for sustained backlog growth, workflow changes for handoff delays, and product or engineering follow-up for recurring feature issues.
In monthly reviews, compare actuals vs. plan and record the cause of each gap. Assign an owner and due date for corrective tasks over the next 2 to 4 weeks. Then check productivity trends and ticket quality - finishing a task doesn't prove it made things better.
When delays cross departments, review handoffs, ownership, and escalation rules.
Conclusion: Build a Balanced Coaching Dashboard
Bring the comparisons above into one coaching view: first response time for initial waits, average handle time for effort, reopen rate for lasting fixes, backlog age for stalled work, and resolution rate for completion.
Define each metric before setting targets. Use historical baselines grouped by priority, channel, and complexity - not universal benchmarks or comparisons between agents with different workloads.
Then review speed and quality together. Pair handle time with reopen rate, and resolution rate with backlog age, to decide where to coach, reassign work, or change workflows. Check the tickets behind the numbers before acting.
Address skill gaps through coaching, clarify who owns handoffs and when to escalate, or review capacity as needed. After making changes, measure results against the same grouped baseline, looking for timely responses, efficient work, lasting resolutions, and a healthy queue - not just better metrics.
FAQs
How do I set realistic help desk metric targets?
Start by setting baseline metrics so you know how you're performing now. Then set specific, measurable goals with clear deadlines that support your business objectives. For example, aim to cut response times by a defined percentage within a set period.
Use gap analysis to compare current performance with your targets, then focus on initiatives that can make the biggest difference and are within reach. Review progress monthly or quarterly, and adjust benchmarks to fit your industry and team size.
How can I tell whether my team needs coaching or more staff?
Before deciding to hire more staff, check whether performance problems come from inefficient processes, gaps in training, or departments working toward different expectations. Review ticket volume and resolution rates to pinpoint the causes and see whether coaching or workflow changes could help.
Growth Shuttle helps SMEs spot problems in day-to-day operations, improve management workflows, and set up feedback loops so teams can work more efficiently without immediately adding staff.
How soon should I expect coaching to improve metrics?
Coaching takes time, and the timeline depends on the scope of your goals. You may see improvements in day-to-day operations within a quarter. Larger changes often call for a structured, 100-day approach to make major gains in performance and governance.
Expect gradual progress as you monitor results, gather feedback, and refine processes. Schedule coaching sessions around your reporting cycle and track operations metrics monthly to keep things moving.