If you are evaluating a business services company for acquisition, or own one and wonder whether private equity interest is warranted, the sector's appeal is not mysterious. Business services private equity has absorbed more middle-market capital over the past decade than nearly any other category. The reasons are structural: recurring revenue, fragmented competition, and the possibility of margin expansion through technology. But the sector also hides traps. Some services businesses look like compounding machines until you realize the labor economics don't scale, or the switching costs you assumed were real evaporate when a contract renews.
This study examines where the business services thesis genuinely works, where it breaks down, and how to distinguish a platform worth building from a roll-up that consumes capital without returning it. The goal is not investment advice. It is a practical framework for understanding which services models reward consolidation and which resist it.
1. Business services is the middle market's favorite engine, and the arithmetic explains why
Private equity's affection for business services is not fashion. It reflects arithmetic. According to PitchBook data, business services consistently ranks among the top three sectors by middle-market deal volume in North America, often representing 20-25% of all transactions in the $50 million to $500 million enterprise value range.
The thesis rests on several structural advantages:
- Asset-light operations: Most services businesses require minimal capital expenditure compared to manufacturing or logistics. Cash conversion is high, which supports leverage and faster equity returns.
- Recurring or repeatable revenue: Many B2B services operate on multi-year contracts or retainer relationships, creating revenue visibility that lenders and equity sponsors value.
- Fragmentation: Most services categories have hundreds or thousands of small operators. This market fragmentation creates acquisition opportunities at reasonable multiples and supports buy-and-build strategy execution.
- Scalable infrastructure: A well-run platform can absorb smaller competitors without proportional overhead growth, generating operating leverage.
These characteristics explain why the sector attracts capital. They do not guarantee returns. The difference between a successful business services roll-up and a disappointing one often comes down to the specific economics of revenue durability, labor, and technology.
2. Recurring contracts, switching costs, and what creates real revenue visibility
Revenue visibility is the first filter. A business services company with 90% revenue under multi-year contracts is a different asset than one with the same revenue from month-to-month project work. The first offers predictability that supports higher leverage and acquisition financing. The second requires constant selling, and any disruption in sales productivity immediately affects cash flow.
What Creates Real Switching Costs
Not all contracts are equal. A three-year agreement with a 90-day termination clause is not the same as a three-year agreement with embedded technology, trained client staff, and regulatory dependencies. True switching costs emerge from:
- Integration depth: Does the service embed in the client's systems, workflows, or data? Outsourced IT services that manage a client's entire infrastructure create higher switching costs than advisory services billed by the hour.
- Regulatory or compliance dependencies: Services tied to regulatory reporting, audits, or certifications create inertia. Clients do not casually switch providers when compliance is at stake.
- Training and institutional knowledge: If the provider's team has spent years learning the client's operations, replacing them means retraining and transition risk.
According to Bain's 2023 Global Private Equity Report, recurring revenue with genuine switching costs commands premium multiples because it reduces both revenue risk and the cost of capital for acquirers.
Distinguishing Contractual from Behavioral Recurrence
Some services companies show high renewal rates without formal contracts. This is behavioral recurrence: clients keep returning because switching is inconvenient, not because they are bound. Behavioral recurrence can be valuable, but it is more fragile. A new procurement officer, a budget cut, or a competitor's aggressive pricing can shift it quickly.
When evaluating a business services target, ask: what would it take for the top 10 clients to leave? If the answer is "they sign a new RFP," the switching cost is lower than it appears.
3. Labor as Cost and as Risk
Business services are fundamentally about people delivering outcomes. This creates a structural tension: labor is both the primary cost driver and the primary delivery mechanism. Managing this tension determines whether a services business can scale margin or remains trapped at fixed profitability.
Labor Cost Structure
Most services businesses run labor costs between 50% and 70% of revenue. This leaves limited room for margin expansion unless you can achieve one of three outcomes:
- Price increases: Raising prices without proportional labor cost increases expands margin, but this requires pricing power, which depends on differentiation and switching costs.
- Utilization improvement: If billable staff are only 60% utilized, operational improvements can increase revenue without adding headcount.
- Labor arbitrage: Shifting delivery to lower-cost geographies or talent pools can reduce cost per unit of output. This is common in tech-enabled services and outsourced services private equity targets.
According to McKinsey's private equity practice, labor arbitrage remains one of the most reliable margin levers in services businesses, but it requires careful execution to avoid quality degradation.
Labor as Operational Risk
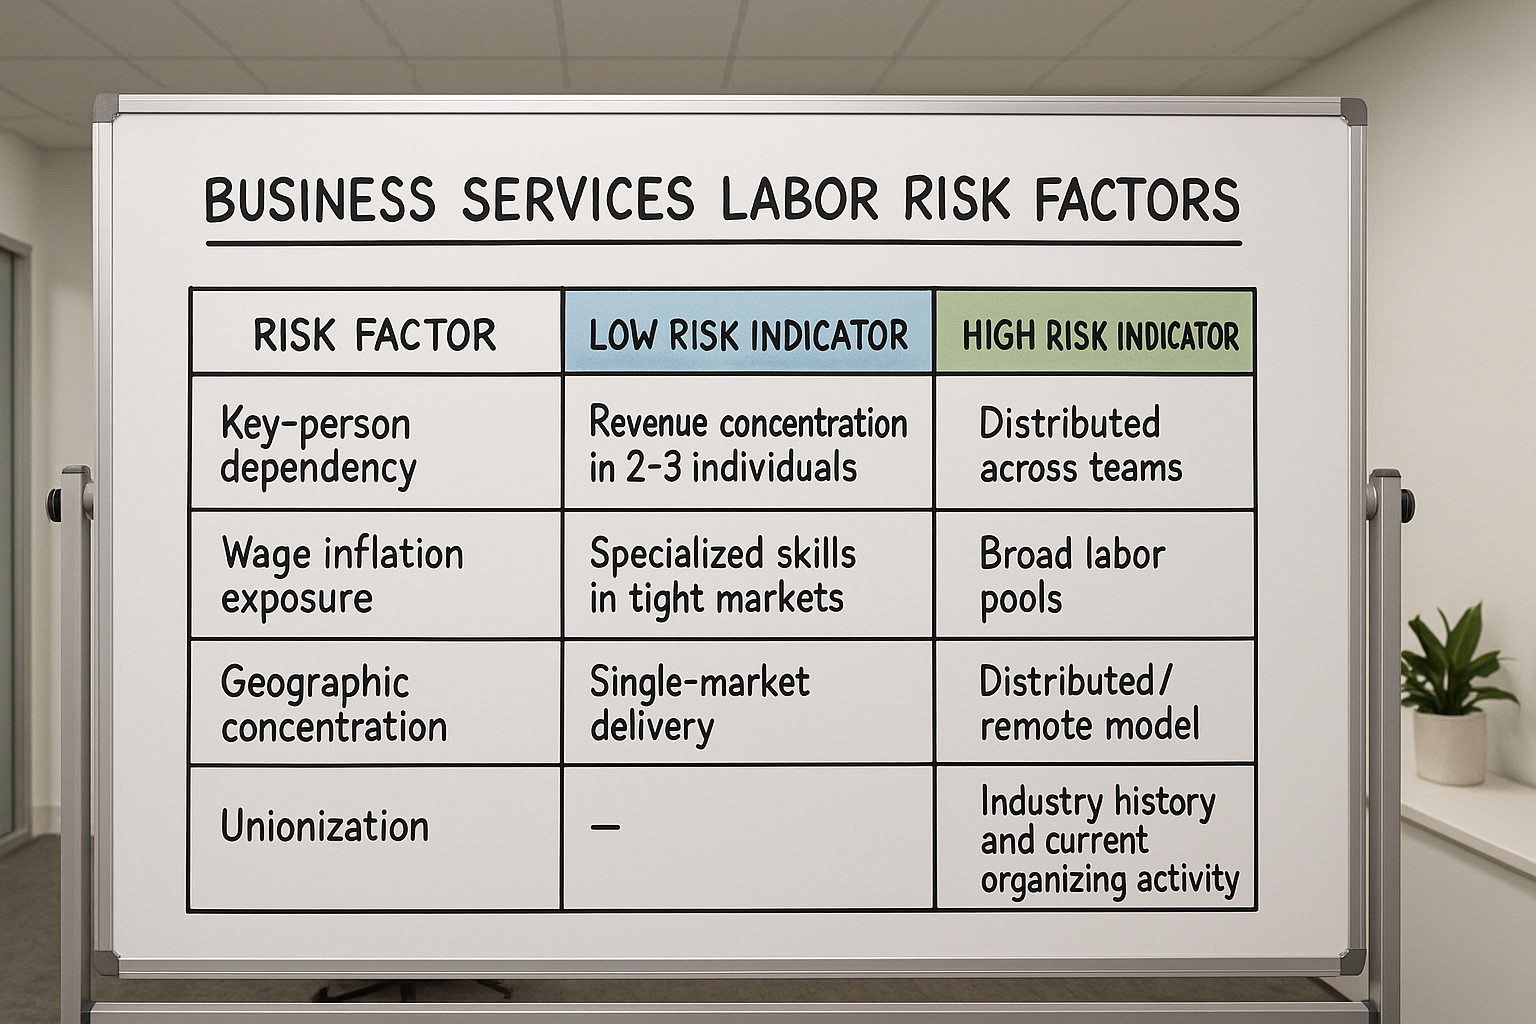
High labor intensity also creates risk. Key-person dependencies, unionization exposure, and wage inflation can erode value rapidly. In a tight labor market, a services business may face margin compression even with growing revenue as it pays more to retain talent.
The COVID-era labor market illustrated this clearly. Many business services companies saw revenue recover faster than margins because wage inflation outpaced price increases. Evaluating labor risk requires understanding not just current costs but the dynamics of the talent pool the business depends on.
4. The Tech-Enablement Lever
Tech-enabled services have become a distinct category within business services private equity. The thesis is straightforward: layer technology onto a traditional services delivery model to improve margins, scalability, and defensibility.
What Tech-Enablement Actually Means
The term is often used loosely. For practical purposes, tech-enablement in a services context means one or more of the following:
- Automation of routine tasks: Software handles data entry, scheduling, reporting, or other repetitive work, reducing labor hours per unit of output.
- Workflow standardization: Technology enforces consistent processes across engagements, improving quality and reducing training costs.
- Client-facing platforms: Proprietary portals or dashboards increase perceived value and create switching costs by embedding the service into client operations.
- Data capture and analytics: Collecting data across engagements enables better service delivery, benchmarking, and potentially new revenue streams.
According to Gartner, B2B services companies that invest in technology-enabled delivery report higher client retention and stronger margin profiles than those relying purely on manual delivery.
The Difference Between Tech-Enabled and Tech-Dependent
A critical distinction: some services businesses have built proprietary technology that differentiates their delivery. Others have simply adopted third-party tools that competitors can also license. The first creates moats. The second creates table stakes.
When evaluating a tech-enabled services company, ask: is the technology proprietary, or is it a configuration of commercially available software? Can competitors replicate the technology stack in 12 months? Does the technology create genuine client lock-in, or is it just a better internal tool?
5. Where Fragmentation Supports a Genuine Roll-Up
Fragmented markets are necessary for private equity roll-up strategy, but fragmentation alone is not sufficient. The question is whether consolidation creates value beyond the sum of the parts.
Conditions for Value-Creating Consolidation
A industry consolidation strategy works when:
- Customers value scale: Larger clients may prefer working with a single provider across geographies or service lines. If consolidation enables serving clients that smaller operators cannot reach, it creates revenue synergies.
- Overhead can be rationalized: Combining back-office functions, technology platforms, or management teams across acquired companies reduces costs.
- Procurement leverage increases: Larger platforms can negotiate better terms with vendors, landlords, and technology providers.
- Talent acquisition improves: Scale can make a company more attractive to skilled professionals who want career paths that small operators cannot offer.
According to BCG's 2023 analysis of private equity value creation, the most successful B2B services roll-ups achieved both revenue synergies (cross-selling, geographic expansion) and cost synergies, while the least successful focused only on cost reduction.
When Fragmentation Persists for Good Reasons
Some markets remain fragmented because consolidation does not create value. This happens when:
- Services are highly localized and relationships are personal, making integration disruptive to client retention.
- The business has minimal overhead to consolidate, so cost synergies are negligible.
- Scale does not improve delivery quality or pricing power, so revenue synergies are limited.
Understanding why a market is fragmented matters as much as recognizing that it is. If fragmentation persists because small operators serve local relationships effectively and efficiently, consolidation may destroy value rather than create it.
6. Signals of a Compounding Versus a Commoditized Services Model
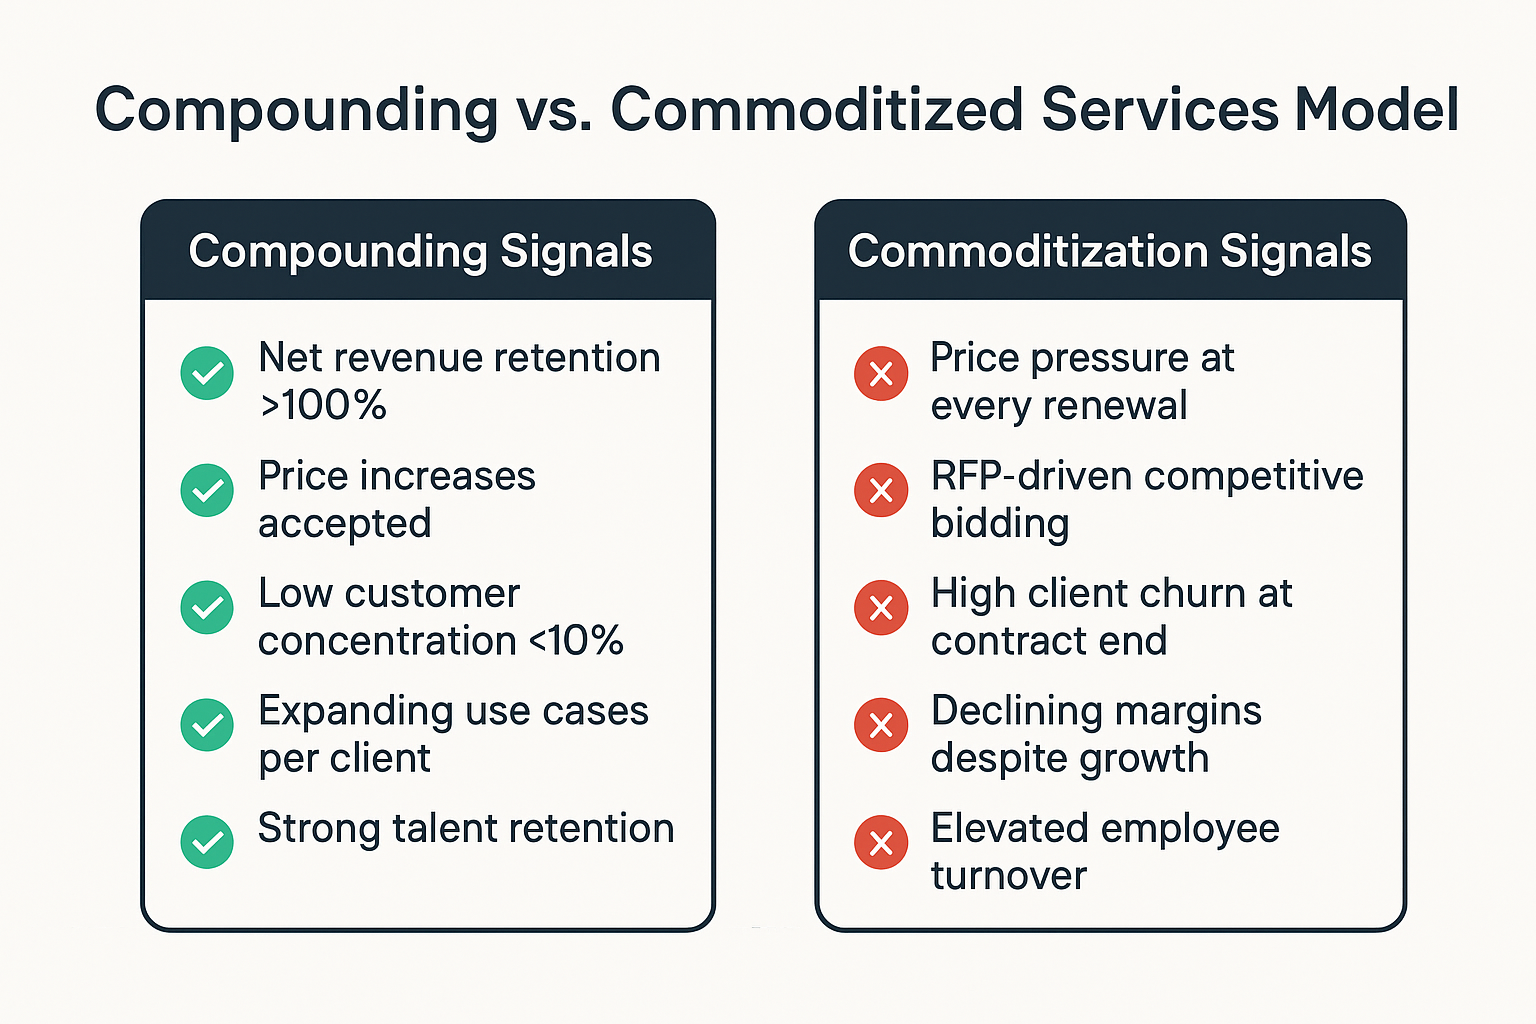
The difference between a compounding services business and a commoditized one often becomes clear only after several years of ownership. But there are early signals.
Compounding Indicators
- Net revenue retention above 100%: Existing clients spend more over time, either through price increases or scope expansion. This indicates the service is becoming more valuable, not less.
- Price increases stick: The company can raise prices without significant client churn, suggesting real differentiation.
- Low customer concentration: No single client represents more than 5-10% of revenue, reducing risk and increasing negotiating leverage.
- Expanding use cases: Clients use the service in new ways or new departments, indicating platform potential.
- Talent attracts talent: The company can recruit high-quality staff without competing purely on compensation, suggesting a reputation or culture advantage.
Commoditization Indicators
- Price pressure at renewal: Every contract renegotiation becomes a pricing negotiation, indicating clients see the service as interchangeable.
- RFP-driven sales: New business comes primarily through competitive bidding processes where price is a primary factor.
- High client churn: Clients leave at contract end, even when satisfied, because switching costs are low.
- Margin compression over time: Even with revenue growth, margins decline as labor costs rise faster than prices.
- Talent turnover: High employee turnover suggests the company is not differentiated as an employer, which often correlates with undifferentiated service delivery.
For deeper insights into sector dynamics, our private equity market intelligence resources cover additional evaluation frameworks.
7. Countercase: Labor-Intensive Services That Don't Scale Margin
Not every business services model suits private equity ownership. Some services businesses generate solid cash flows and support their founders well but resist the margin expansion that private equity returns require.
Structural Margin Limits
Consider a staffing business that places temporary workers at client sites. Revenue may be predictable, but margins are structurally limited. The company earns a spread between what clients pay and what workers receive, and competitive dynamics constrain that spread. Technology can improve back-office efficiency, but it cannot fundamentally change the labor economics of placement.
Similarly, some professional services firms depend entirely on senior practitioner time. An accounting firm where partners perform most billable work cannot scale without adding partners. Adding partners dilutes economics per partner. The business can grow, but margin expansion is elusive.
When Labor Arbitrage Backfires
Labor arbitrage offers a path to margin expansion, but it carries execution risk. Shifting delivery offshore can reduce costs, but if quality declines, client retention suffers. The savings are real. The client loss is also real. The net effect may be negative.
According to Harvard Business Review research on global service delivery, companies that pursue labor arbitrage without investing in coordination, quality management, and cultural alignment often experience initial cost savings followed by service degradation and client attrition.
Recognizing Structural Limits Early
When evaluating a business services company, ask: if we execute perfectly for five years, what is the realistic margin profile? If the answer is roughly the same as today, the investment thesis must rely entirely on growth and multiple arbitrage. That is a different risk profile than a business with genuine margin expansion potential.
8. Value-Creation Levers: Pricing, Utilization, Tech-Enablement, Cross-Sell
For business services companies that do have margin expansion potential, the levers are well understood. Execution determines outcomes.
Pricing Discipline
Many smaller services businesses underprice. Founders may have set rates years ago and never revisited them. Clients may have negotiated discounts that became permanent. A pricing review, often supported by third-party benchmarking, can identify opportunities to raise rates without client loss.
The key is understanding price elasticity. Some clients will accept a 10% increase without discussion. Others will leave. Segmenting the client base by price sensitivity enables targeted increases rather than blanket changes.
Utilization Improvement
In professional services, utilization is the percentage of available staff time that is billable. Most services businesses run utilization between 60% and 75%. Improving utilization from 65% to 75% with the same staff increases revenue by 15% with minimal cost increase. This is pure margin expansion.
Utilization improvement requires better sales forecasting, project management, and resource allocation. Technology can help, but the fundamental discipline is operational.
Technology Investment
As discussed earlier, tech-enablement can automate routine tasks, standardize delivery, and create switching costs. The investment thesis should identify specific technology initiatives with quantified impact, not generic "digital transformation" aspirations.
Cross-Sell and Scope Expansion
Services businesses often underinvest in account expansion. Existing clients are the most efficient source of new revenue because acquisition costs are near zero. A structured approach to identifying expansion opportunities, whether through periodic account reviews or systematic needs assessment, can accelerate revenue growth.
For acquirers pursuing an add-on acquisition strategy, cross-sell is often the primary revenue synergy. The platform sells the add-on's services to its existing clients, and vice versa.
9. Business Services Quality Scorecard
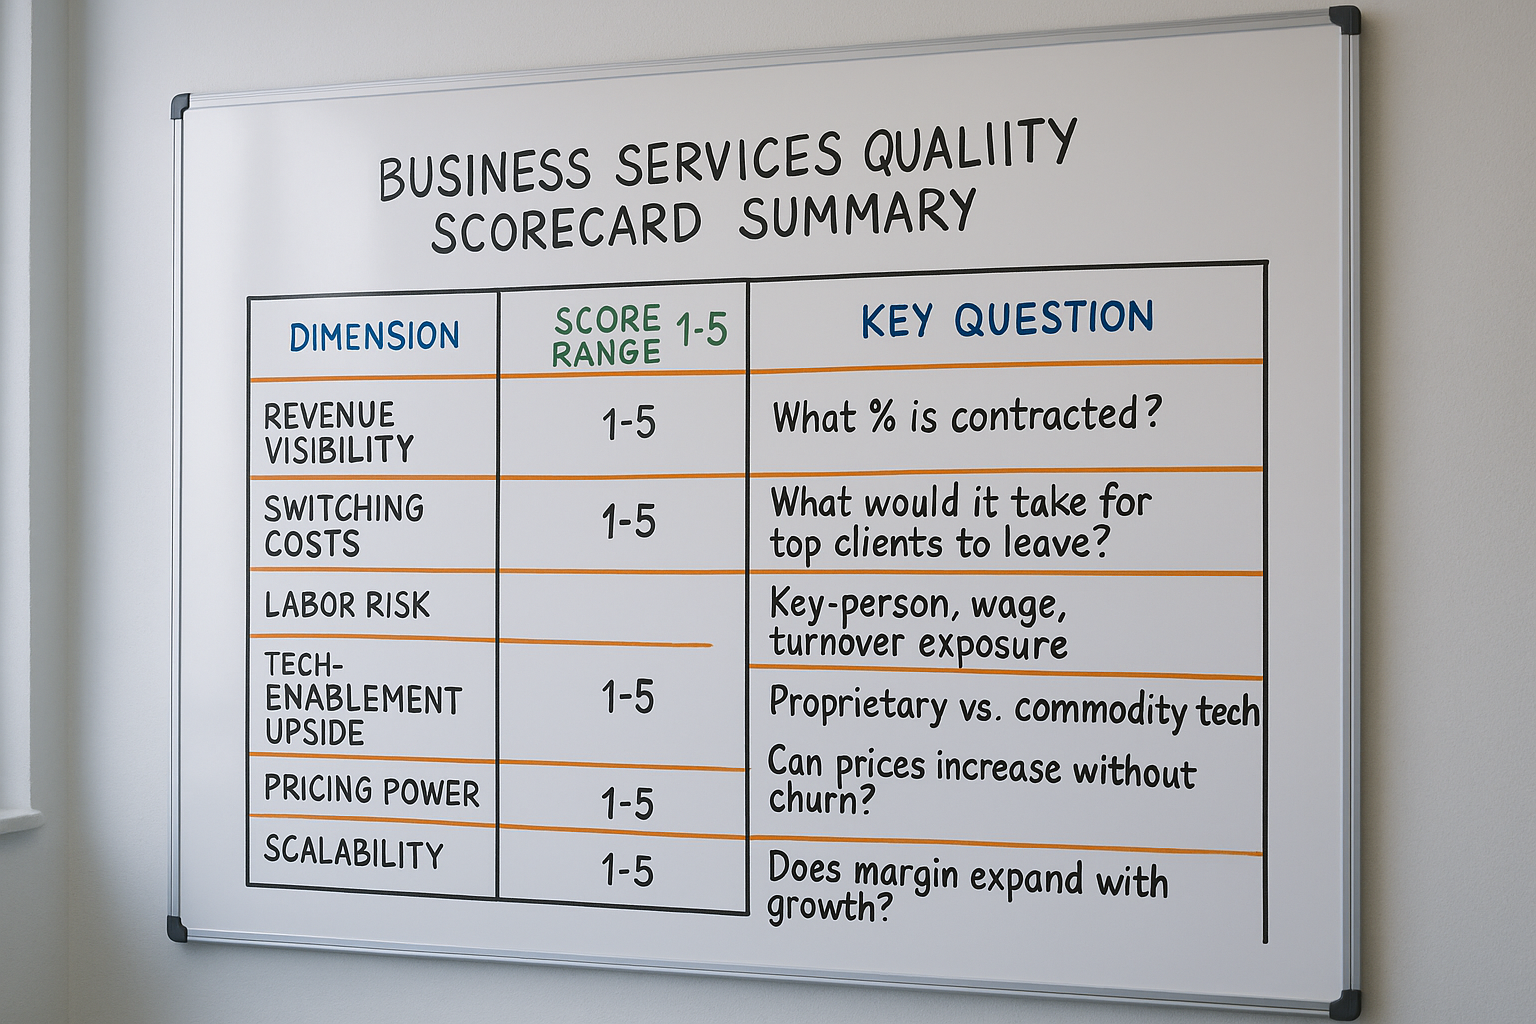
The following scorecard provides a framework for evaluating business services companies across the dimensions that matter most for value creation. Each dimension is scored from 1 to 5, with specific criteria for each rating.
| Dimension | 1 (Weak) | 3 (Moderate) | 5 (Strong) |
|---|---|---|---|
| Revenue Visibility | Less than 50% of revenue under contract; project-based with no repeat pattern | 50-75% contracted or recurring; moderate client concentration | More than 85% under multi-year contracts; diversified client base with no client above 5% |
| Switching Costs | Service is interchangeable; clients switch regularly for price | Some integration with client systems or processes; moderate retention | Deep integration into client workflows, data, or compliance; high retention regardless of pricing |
| Labor Risk | High key-person dependency; concentrated in tight labor market; high turnover | Some key-person risk; moderate labor market conditions; average turnover | Distributed expertise; broad talent pool; below-market turnover with strong employer brand |
| Tech-Enablement Upside | Manual delivery with limited technology; no proprietary systems; competitors use same tools | Some automation; standard industry software; technology roadmap in development | Proprietary technology differentiates delivery; creates client lock-in; clear automation roadmap with quantified impact |
| Pricing Power | Constant price pressure; RFP-driven sales; price is primary buying criterion | Moderate ability to raise prices; some differentiation recognized by clients | Annual price increases accepted; clients value quality over cost; low price elasticity |
| Scalability | Margins flat or declining with growth; no operating leverage; overhead scales linearly | Moderate operating leverage; some fixed-cost absorption possible | Clear path to margin expansion; infrastructure supports 2x revenue without proportional cost |
| Consolidation Potential | Fragmented market but no synergy sources; local relationships resist integration | Some cost or revenue synergies available; integration complexity moderate | Clear synergy case; customers value scale; technology platform enables efficient integration |
Scoring interpretation: A total score of 28 or above suggests a business services company with strong fundamentals for value creation. A score of 21-27 indicates moderate potential with specific risks to address. Below 21 suggests structural challenges that may limit returns regardless of execution quality.
10. Summary and Key Takeaways
Business services private equity remains attractive because the sector offers recurring revenue, fragmentation for acquisitions, and technology-driven margin expansion potential. But not every services business fits the thesis.
Key questions to answer before committing capital:
- Is the revenue truly recurring, or is it behavioral? What would it take for top clients to leave?
- What are the realistic switching costs, and are they contractual, technical, or just inconvenience?
- What is the labor cost structure, and is there a realistic path to margin expansion through pricing, utilization, or labor arbitrage?
- Is the technology proprietary and differentiating, or is it a configuration of tools competitors can replicate?
- Why is this market fragmented, and does consolidation create real synergies or just aggregation?
- Does the company show compounding signals (net revenue retention above 100%, pricing power, talent retention) or commoditization signals (price pressure, RFP-driven sales, high churn)?
The business services sector will continue attracting capital because its structural characteristics support private equity returns when the fundamentals are sound. The discipline is in distinguishing businesses that genuinely compound from those that merely appear to fit the pattern.
Subscribe to the Growth Shuttle research briefing for the business-services briefing, and download the Business-Services Quality Scorecard.