Here is a pattern I see repeatedly when working with SME founders who have taken private equity investment: the board deck grows to forty slides, tracking everything from website bounce rates to employee satisfaction scores. Six months later, the management team spends more time producing reports than running the business. Meanwhile, the three metrics that actually determine whether the investment succeeds get buried on slide thirty-seven.
Private equity KPIs are not the same as operational dashboards. They exist to answer a specific question: is this business on track to deliver the returns we underwrote at entry? According to McKinsey research, top-quartile PE firms generate roughly 20% of their returns from revenue growth, 45% from margin expansion, and 35% from multiple expansion. Yet most portfolio company reporting frameworks treat all metrics as equally important, which means none of them get the focus they deserve.
This guide breaks down the KPIs that private equity investors actually use to evaluate portfolio performance, explains why each one matters for value creation, and provides a practical framework for SME operators to build a measurement system that serves both the business and its investors.
The difference between measuring business health and measuring trajectory toward exit
Traditional business metrics measure health. Private equity KPIs measure trajectory toward exit value. The distinction matters because a healthy business and a valuable business are not always the same thing.
Consider two software companies with identical $10 million ARR. Company A has 95% gross margins but flat growth. Company B has 75% gross margins but grows at 40% annually. By standard operating metrics, Company A looks healthier. By PE metrics, Company B is worth multiples more because recurring revenue growth compounds into enterprise value.
PE investors think in terms of the value creation bridge, which links entry valuation to exit valuation through specific, measurable improvements. Every KPI should connect to one of four levers:
- Revenue growth: organic expansion, pricing power, new market entry
- Margin expansion: operational efficiency, procurement savings, mix shift
- Working capital optimization: cash conversion, inventory turns, receivables management
- Multiple expansion: quality of earnings, growth durability, market positioning
As I covered in the piece on private equity value creation, the evidence shows that operational improvement accounts for the majority of returns in the current environment. Financial engineering alone no longer delivers top-quartile performance.
The financial KPIs every PE firm tracks without exception
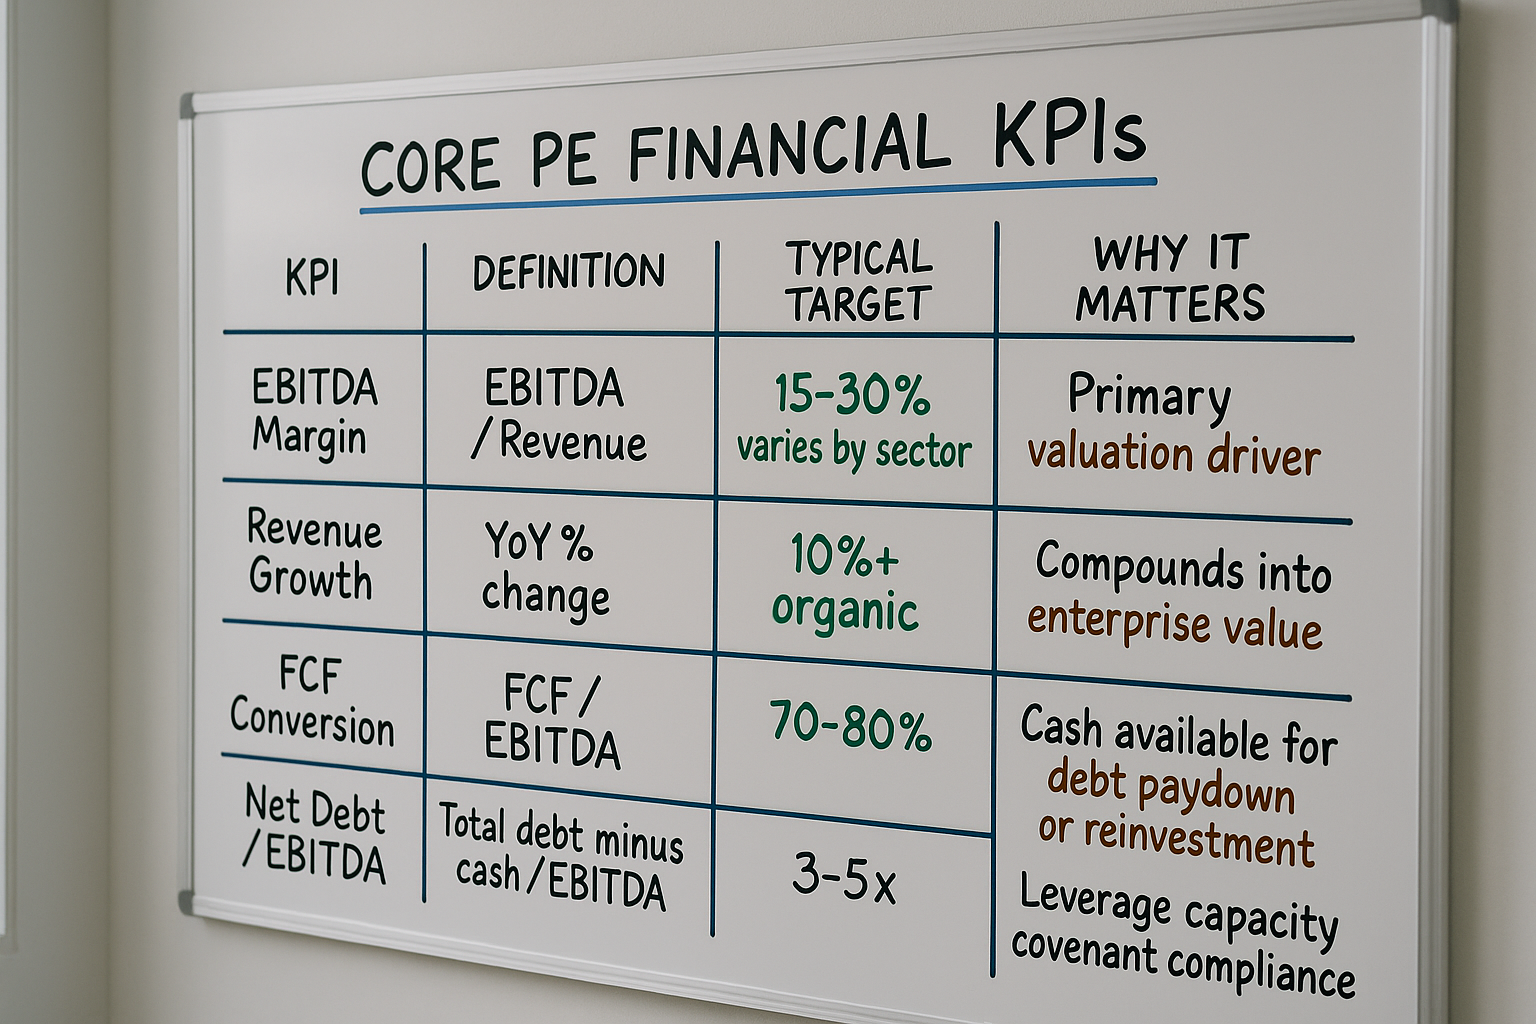
Every PE firm, regardless of sector focus or investment strategy, tracks a core set of financial metrics. These are non-negotiable because they translate directly into valuation models and debt covenant compliance.
EBITDA and Adjusted EBITDA
EBITDA remains the universal language of private equity. Bain's 2024 Global Private Equity Report notes that EV/EBITDA multiples continue to serve as the primary valuation benchmark across most sectors. However, the adjustments matter as much as the headline number.
Common EBITDA adjustments include one-time costs, owner compensation normalization, and run-rate synergies. The key discipline is ensuring adjustments are defensible to a future buyer. I have seen deals fall apart because sellers included aggressive adjustments that acquirers refused to credit.
Revenue Growth Rate
Growth rate is typically measured as year-over-year percentage change, but the composition matters. PE investors distinguish between:
- Organic growth: expansion from existing operations
- Inorganic growth: acquired revenue
- Price versus volume: pricing power signals defensibility
According to BCG's 2023 Value Creation Report, companies that deliver consistent organic growth above 10% annually command valuation premiums of 20-40% versus peers.
Free Cash Flow Conversion
EBITDA means nothing if it does not convert to cash. Free cash flow conversion, typically expressed as FCF/EBITDA, reveals the true economic engine of the business. Healthy conversion rates vary by industry, but 70-80% is a common benchmark for asset-light businesses.
Poor conversion often signals issues with working capital management. For SMEs evaluating financing options to improve cash conversion, understanding the tradeoffs between trade credit and supplier financing can unlock meaningful improvements.
Net Debt to EBITDA
Leverage ratio determines financing capacity and often governs covenant compliance. Most PE-backed companies operate at 3-5x net debt to EBITDA, though this has compressed in the current rate environment. According to S&P Global, average leverage on new LBOs dropped from 5.7x in 2021 to 4.9x in 2023.
Operational indicators that predict financial performance
Financial metrics tell you what happened. Operational KPIs tell you why it happened and whether it will continue. Smart PE investors track leading indicators that predict future financial performance.
Customer Metrics
For recurring revenue businesses, customer health is the leading indicator of sustainable growth:
- Net Revenue Retention (NRR): revenue from existing customers including expansion, contraction, and churn. World-class SaaS companies achieve NRR above 120%, meaning they grow even without new customer acquisition.
- Gross Revenue Retention: revenue retained excluding expansion. This isolates the churn problem.
- Customer Acquisition Cost (CAC) Payback: months to recover the cost of acquiring a customer. Under 18 months is generally healthy for B2B.
- Logo Churn: percentage of customers lost, regardless of size. High logo churn with low revenue churn suggests concentration risk.
Sales Pipeline Metrics
Pipeline metrics predict near-term revenue performance:
- Pipeline Coverage: total qualified pipeline divided by target. 3x coverage is a common benchmark.
- Win Rate: percentage of opportunities that convert. Changes in win rate often signal competitive dynamics.
- Sales Cycle Length: average days from opportunity creation to close. Lengthening cycles may indicate market headwinds.
Operational Efficiency
Efficiency metrics connect operational execution to financial outcomes:
- Revenue per Employee: crude but useful benchmark for productivity
- Gross Margin by Product/Segment: identifies where to allocate resources
- Capacity Utilization: for manufacturing or service delivery businesses
The recruitment function often becomes a bottleneck for scaling portfolio companies. Using data analytics in recruitment can significantly improve hiring velocity and quality, which flows directly into revenue per employee metrics.
Utilization and margin by account only become reliable once hours, tasks and invoices are joined. For what that looks like in practice, see the operational efficiency graphs in the AI Ops Hive.
Working capital metrics that free up cash without new financing
Working capital optimization is one of the fastest paths to value creation, yet it receives less attention than growth or margin initiatives. For SMEs, improving working capital can fund growth without additional debt or equity.
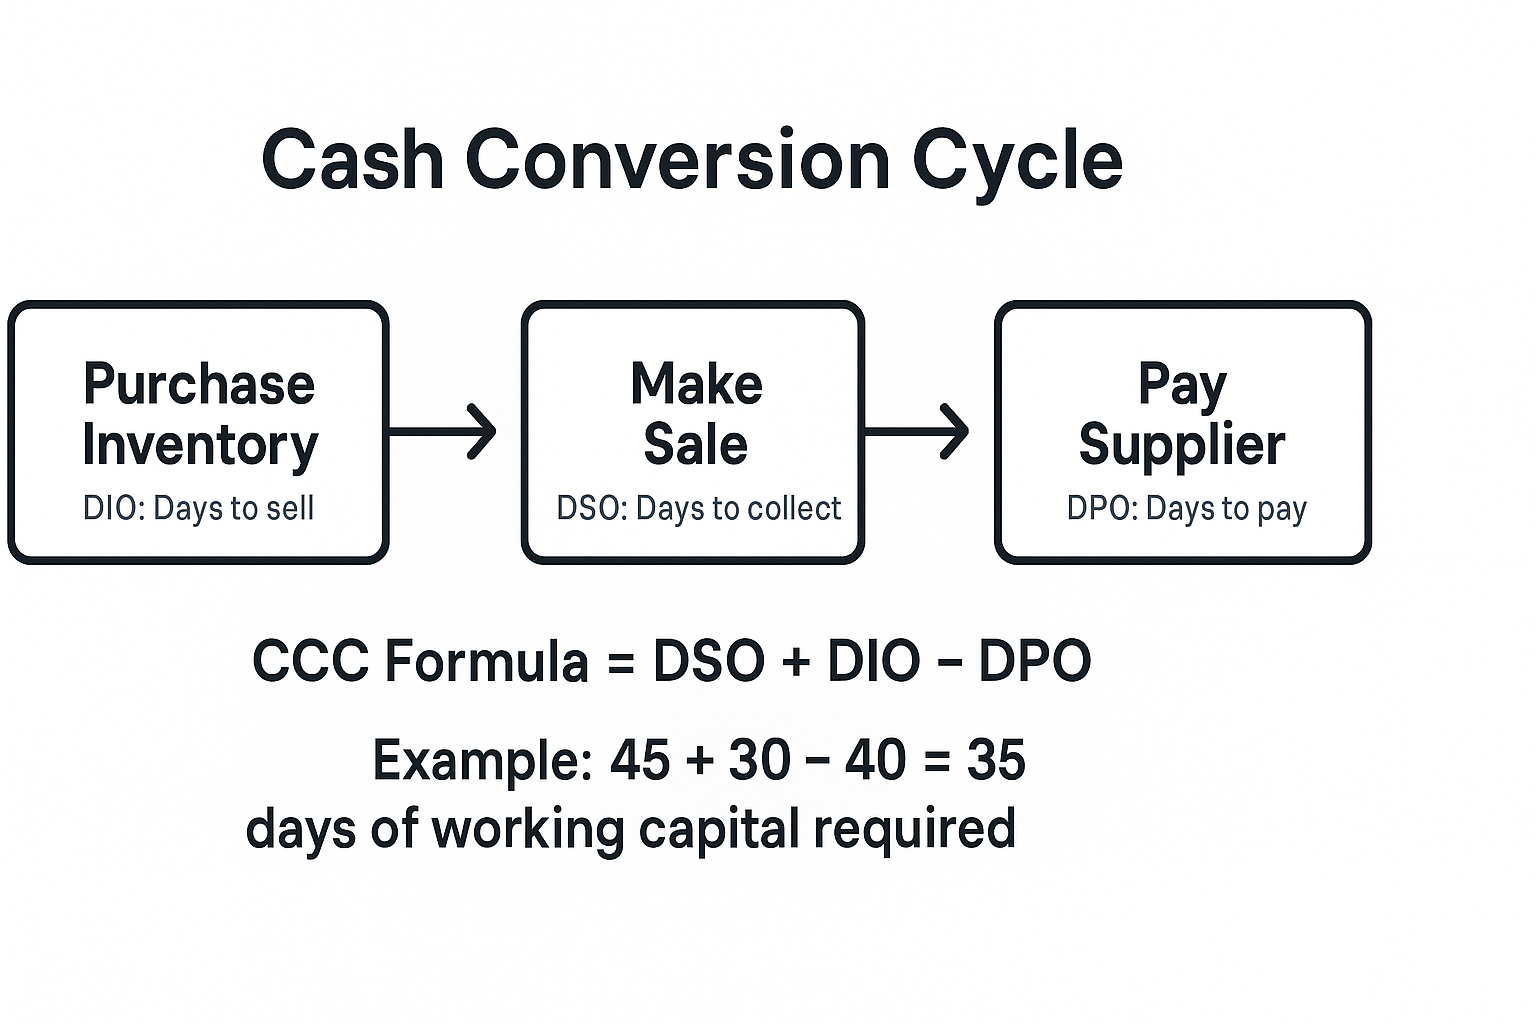
Days Sales Outstanding (DSO)
DSO measures average collection time for receivables. According to Deloitte, reducing DSO by 10 days can release 2-3% of revenue as available cash. For a $50 million business, that represents $1-1.5 million in freed capital.
Improvement levers include invoice timing, payment terms, collection process discipline, and customer creditworthiness screening.
Days Inventory Outstanding (DIO)
DIO measures how long inventory sits before sale. Excess inventory ties up cash and risks obsolescence. However, insufficient inventory creates stockouts and lost sales. The goal is optimization, not minimization.
Days Payables Outstanding (DPO)
DPO measures how long the company takes to pay suppliers. Extending payables without damaging supplier relationships is a legitimate cash management strategy, though it requires careful stakeholder management.
Cash Conversion Cycle (CCC)
The cash conversion cycle combines these metrics: CCC = DSO + DIO - DPO. This tells you how many days of working capital the business requires. Negative CCC, common in businesses that collect before they pay suppliers, represents a structural financing advantage.
What buy-and-build investors measure across multiple acquisitions
PE firms pursuing buy-and-build strategies track additional metrics that measure platform health and integration success. For SME operators involved in add-on acquisitions, these KPIs determine whether deals create or destroy value.
Integration Execution
- Synergy Capture Rate: actual synergies realized versus deal model projections, typically measured at 12 and 24 months post-close
- Integration Milestone Completion: percentage of planned integration tasks completed on schedule
- Key Person Retention: retention of identified critical employees through integration period
As detailed in my analysis of buy-and-build strategy, the difference between value-creating and value-destroying roll-ups often comes down to integration execution discipline.
Platform Scalability
- Corporate Overhead as Percentage of Revenue: tracks whether the platform is achieving scale benefits
- Cross-Sell Penetration: percentage of acquired customers purchasing additional products
- System Consolidation Progress: migration of acquired businesses onto common technology infrastructure
Due Diligence Quality
Sophisticated PE firms track whether their due diligence process accurately predicts post-acquisition performance. This creates accountability and continuous improvement in deal evaluation. For operators going through acquisition, understanding the full scope of M&A due diligence requirements prepares you for investor scrutiny.
Leading indicators worth more attention than lagging results
The best PE operators focus disproportionate attention on leading indicators, metrics that predict future outcomes while there is still time to influence them.
Market Position Metrics
- Share of Voice: brand visibility relative to competitors
- Net Promoter Score Trends: directional changes matter more than absolute levels
- Competitive Win/Loss Analysis: tracking which competitors you beat or lose to
Understanding market structure and competitive dynamics is essential for building defensible positions. The disruptive innovation framework provides tools for identifying threats before they materialize in financial results.
Product and Service Health
- Feature Adoption Rates: for software and technology businesses
- Product-Led Growth Metrics: viral coefficients, time to value
- Service Quality Scores: customer satisfaction with delivery
Talent and Culture
- Employee Engagement Trends: leading indicator of productivity and retention
- Key Role Fill Rates: ability to attract critical talent
- Management Bench Strength: readiness of next-level leaders
Leadership alignment becomes especially critical during transitions. The research on leadership style alignment in M&A demonstrates how cultural mismatches derail otherwise sound deals.
Making your performance data legible to investors who review hundreds of reports
Producing metrics is not the same as reporting them effectively. PE investors receive hundreds of pages of portfolio company data each month. The companies that get attention, and support, are those that make their performance legible.
The 3-30-3 Framework
Effective PE reporting follows a layered structure:
- 3-minute executive summary: key metrics, trajectory, and one or two items requiring discussion
- 30-minute board deck: detailed performance against plan, initiative updates, and forward-looking guidance
- 3-hour deep dives: quarterly working sessions on specific value creation levers
Variance Analysis
PE investors care less about absolute numbers than they care about variance from plan and variance from prior period. Every metric should show:
- Current period actual
- Budget/plan for the period
- Prior year actual
- Explanation of meaningful variances
Forward-Looking Elements
Historical reporting is necessary but insufficient. Strong PE reporting includes:
- Rolling forecasts: updated projections based on current trajectory
- Leading indicator trends: early warning signals
- Risk and opportunity register: proactive identification of what might change
Mistakes that turn useful metrics into compliance theater
Over the years, I have observed several recurring patterns that undermine KPI effectiveness in PE-backed businesses.
Tracking Too Many Metrics
When everything is a priority, nothing is a priority. Gartner research suggests that executive dashboards with more than 7-10 metrics suffer from attention dilution. The discipline is deciding what not to measure.
Confusing Activity with Outcome
Activities like meetings held, emails sent, or reports produced are not KPIs. They may be useful management data, but they do not belong in board reporting. KPIs must connect to value creation.
Measuring What Is Easy Instead of What Matters
Some important metrics are hard to capture accurately. Customer lifetime value, for example, requires assumptions about retention and expansion. The temptation is to substitute metrics that are easy to measure. Resist this temptation.
Ignoring Data Quality
A metric is only as good as the underlying data. Before implementing a KPI framework, audit the data sources. Inconsistent definitions, manual processes, and system integration gaps all compromise reliability.
Static Target Setting
Targets set during deal underwriting may become irrelevant as market conditions change. Effective PE partnerships include mechanisms for resetting targets when underlying assumptions change materially. This requires trust and transparency between operators and investors.
How to build a measurement system that serves operations and investors equally
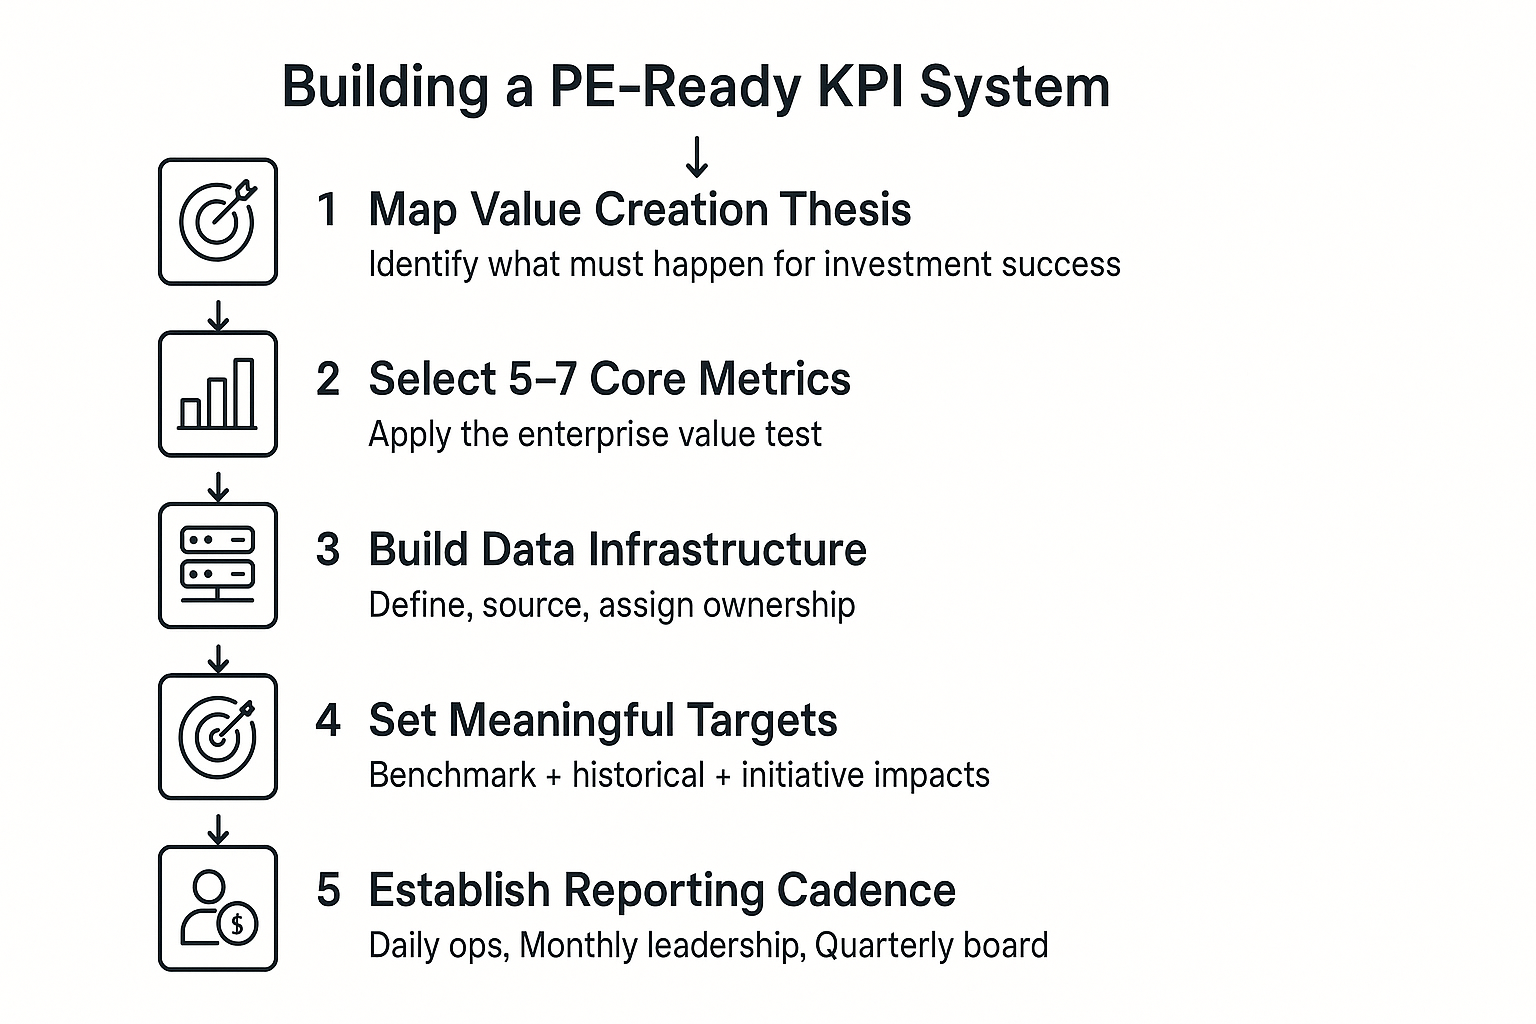
For SME operators preparing for PE investment or working with existing investors, here is a practical framework for building a measurement system that serves both operational and investor needs.
Step 1: Map the Value Creation Thesis
Start with the investment thesis. What must happen for this investment to succeed? As outlined in the framework for private equity investment thesis development, every thesis should articulate specific, measurable improvements.
Step 2: Identify the 5-7 Metrics That Matter Most
For each element of the value creation thesis, identify one or two metrics that best capture progress. Apply the test: if this metric improves, does enterprise value increase?
Step 3: Establish Data Infrastructure
Determine how each metric will be calculated, where the data comes from, and who owns accuracy. Document definitions precisely. "Revenue" sounds simple until you realize people disagree about treatment of discounts, returns, and timing.
Step 4: Set Meaningful Targets
Targets should be ambitious but achievable. Use external benchmarks where available, historical performance as a baseline, and specific initiative impacts to build up to targets.
Step 5: Build the Reporting Cadence
Different metrics require different frequencies:
- Daily/Weekly: operational leading indicators reviewed by management
- Monthly: financial and operational KPIs reviewed by leadership team
- Quarterly: comprehensive performance review with board and investors
Step 6: Create Accountability Mechanisms
Each KPI needs an owner responsible for performance. This person should have authority to influence the metric and accountability for results. Consider linking compensation to KPI achievement for senior leaders.
How metrics shift from deal close through to exit preparation
The metrics that matter shift as the investment matures. Understanding this evolution helps operators anticipate what investors will prioritize at each stage.
First 100 Days
Focus on validating the deal thesis and establishing measurement infrastructure. Key metrics include confirmation of underwriting assumptions, quick win identification and capture, and team assessment and alignment.
Year 1: Foundation Building
Emphasis shifts to operational improvement and growth acceleration. Priority metrics include organic revenue growth trajectory, margin improvement initiatives, and integration progress for acquisitions.
Years 2-3: Scaling
With foundation established, focus turns to sustainable growth at scale. Key metrics include market share gains, operational efficiency ratios, and management team bench strength.
Pre-Exit: Value Crystallization
As exit approaches, metrics shift toward demonstrating investment attractiveness. Focus areas include quality of earnings, growth durability, and defensibility of competitive position.
The current private equity market environment adds urgency to value crystallization, as buyers scrutinize fundamentals more carefully than during the low-rate years.
Managing the politics and relationships that surround performance data
KPIs exist within an organizational and political context. Managing stakeholders around metrics is as important as selecting the right metrics.
Board and Investor Relations
Proactive communication about metrics, especially when performance lags, builds trust. Investors generally respond better to early identification of problems with proposed solutions than to surprises. The framework for understanding stakeholder influence in process change applies directly to KPI discussions.
Management Team Alignment
Ensure the leadership team understands and commits to the KPI framework. Metrics imposed without buy-in become compliance exercises rather than management tools.
Employee Communication
Consider which metrics to share organization-wide. Transparency about performance can drive engagement and accountability, but requires thoughtful communication about context and expectations.
Checklist for evaluating your current KPI framework
Use this checklist to evaluate and improve your current KPI framework:
- Strategic Alignment: Every KPI connects to a specific value creation lever
- Completeness: Framework covers financial, operational, and leading indicators
- Focus: Core dashboard contains 7 or fewer metrics
- Data Quality: Definitions are documented and data sources are reliable
- Targets: Each metric has a specific, achievable target
- Ownership: Every KPI has a named owner with accountability
- Reporting: Cadence matches decision-making needs
- Variance Analysis: Reports explain deviations from plan and prior period
- Forward-Looking: Framework includes leading indicators and forecasts
- Stakeholder Alignment: Investors, board, and management share understanding of priorities
Building an effective KPI framework is not a one-time exercise. The best operators continuously refine their metrics as the business evolves and as they learn what truly predicts success.
If you are preparing your SME for PE investment, managing portfolio company performance, or simply want to bring institutional rigor to your measurement systems, structured advisory support can accelerate your progress. Reach out to discuss how to build a KPI framework that serves both your operational needs and investor expectations.