You are underwriting a software business with 92% gross revenue retention, 18% year-over-year growth, and a founder who insists the company has "sticky" customers. The seller's quality of earnings report shows clean EBITDA margins. The product handles a compliance workflow that customers cannot easily replace. On paper, this looks like the recurring revenue asset every software private equity fund wants to own.
Then you pull the cohort data. The 2021 and 2022 customer vintages retain at 95%. The 2023 cohort retains at 84%. Expansion revenue has been flat for six quarters. The top 20% of customers drive 70% of net revenue retention, and three of them are in contract renegotiation. Suddenly, the "recurring" revenue looks more like "temporarily stable" revenue, and the entry multiple feels less defensible.
This is the operating reality of software private equity today. The sector attracts capital because recurring revenue, properly understood, compounds in ways that project-based businesses cannot. But the 2021-2022 multiple environment trained buyers to pay for growth trajectories that often masked retention decay, customer concentration, and GTM inefficiency. The reset since then has forced a harder question: which software businesses actually compound, and which simply delay churn?
This guide walks through the thesis mechanics, the underwriting signals that separate durable from decaying recurring revenue, and the value-creation levers that matter once you own the asset. It is not investment advice, and it is not a tutorial on SaaS metrics. It is a sector study for operators and deal teams who need to distinguish between software businesses worth owning and software businesses that only look that way.
Why recurring revenue changes what a buyer underwrites
The software buyout thesis starts with a structural difference in cash flow predictability. A professional services firm begins each year at zero booked revenue. A software business with annual contracts begins the year with a substantial portion of revenue already under agreement. That difference changes how you model downside, how you stress-test leverage, and how you think about the margin of safety in your underwriting.
But the thesis is more specific than "predictable revenue is good." What recurring revenue actually provides, when it works, is a compounding engine. Each customer cohort, if retained, becomes a base layer that next year's sales effort can build on rather than replace. A business with 95% gross retention and 110% net revenue retention grows its existing customer base by 5% annually before a single new logo is acquired. A business with 85% gross retention and 95% net revenue retention shrinks its existing base by 5% annually, which means the sales team is running uphill.
This compounding dynamic, or its absence, is why software private equity firms focus on retention metrics before growth metrics. Growth can be purchased through sales and marketing spend. Retention reflects whether the product actually solves a problem customers need solved, and whether the business has the operational discipline to keep them.
Understanding how recurring revenue compounds is foundational to any private equity investment thesis in the software sector. The underwriting must answer whether the compounding engine is real or whether growth is masking decay.
The structural advantage in downside scenarios
Recurring revenue businesses also behave differently in stress. During economic contractions, customers may reduce discretionary spending immediately, but canceling embedded software is harder. The switching costs, both technical and organizational, create friction that protects revenue through cycles. According to McKinsey's analysis of software M&A, recurring revenue businesses demonstrated 2-3x more revenue stability during the 2020 downturn than comparable transaction-based technology companies.
This downside protection is part of why software assets historically commanded premium multiples. But the protection only holds if retention is durable, not merely current. A business with 90% retention today and deteriorating product-market fit will not retain that stability.
How net revenue retention, churn, and expansion drive the compounding engine
If you underwrite software businesses long enough, you learn to distrust top-line growth as a standalone metric. Growth can come from three sources: new customer acquisition, expansion within existing customers, and one-time revenue that gets classified as recurring. Only one of those sources tells you much about the underlying business quality.
Net revenue retention, or NRR, measures how much revenue you retain and expand from your existing customer base, excluding new customer acquisition. It combines gross retention (the percentage of contracted revenue you keep, ignoring expansion) with expansion (the percentage you grow from upsells, cross-sells, and price increases).
According to Bessemer Venture Partners' State of the Cloud report, the median public SaaS company has net revenue retention around 110%, meaning the existing customer base grows 10% annually without any new sales. Elite businesses, often vertical SaaS companies with deep workflow integration, post NRR above 120%. Struggling businesses post NRR below 100%, which means the customer base is shrinking regardless of how many new logos the sales team closes.
Gross retention as the floor
Expansion revenue can mask retention problems. A business with 80% gross retention and 115% net revenue retention is losing 20% of its customers or contracted revenue annually, but offsetting that loss through aggressive expansion with survivors. This can work, but it creates concentration risk. The business becomes dependent on its largest customers continuing to expand, and if expansion stalls, the underlying decay becomes visible.
I look at gross retention first because it tells me how many customers are actively leaving or downsizing. A gross retention rate below 85% in a B2B software context is a signal of product-market fit problems, competitive displacement, or structural issues with the customer segment. Anything above 90% suggests the product is embedded enough that customers do not leave voluntarily.
The cohort view matters more than the aggregate
Aggregate retention metrics hide vintage effects. A business that acquired high-quality customers in 2020-2021 may show strong retention on a blended basis, but if the 2023 cohort retains at 75%, you are underwriting a deteriorating trajectory. Cohort analysis, breaking retention by customer acquisition year, reveals whether retention is improving, stable, or decaying. This is non-negotiable diligence in any SaaS private equity transaction.
What the multiple reset means for growth versus profitability
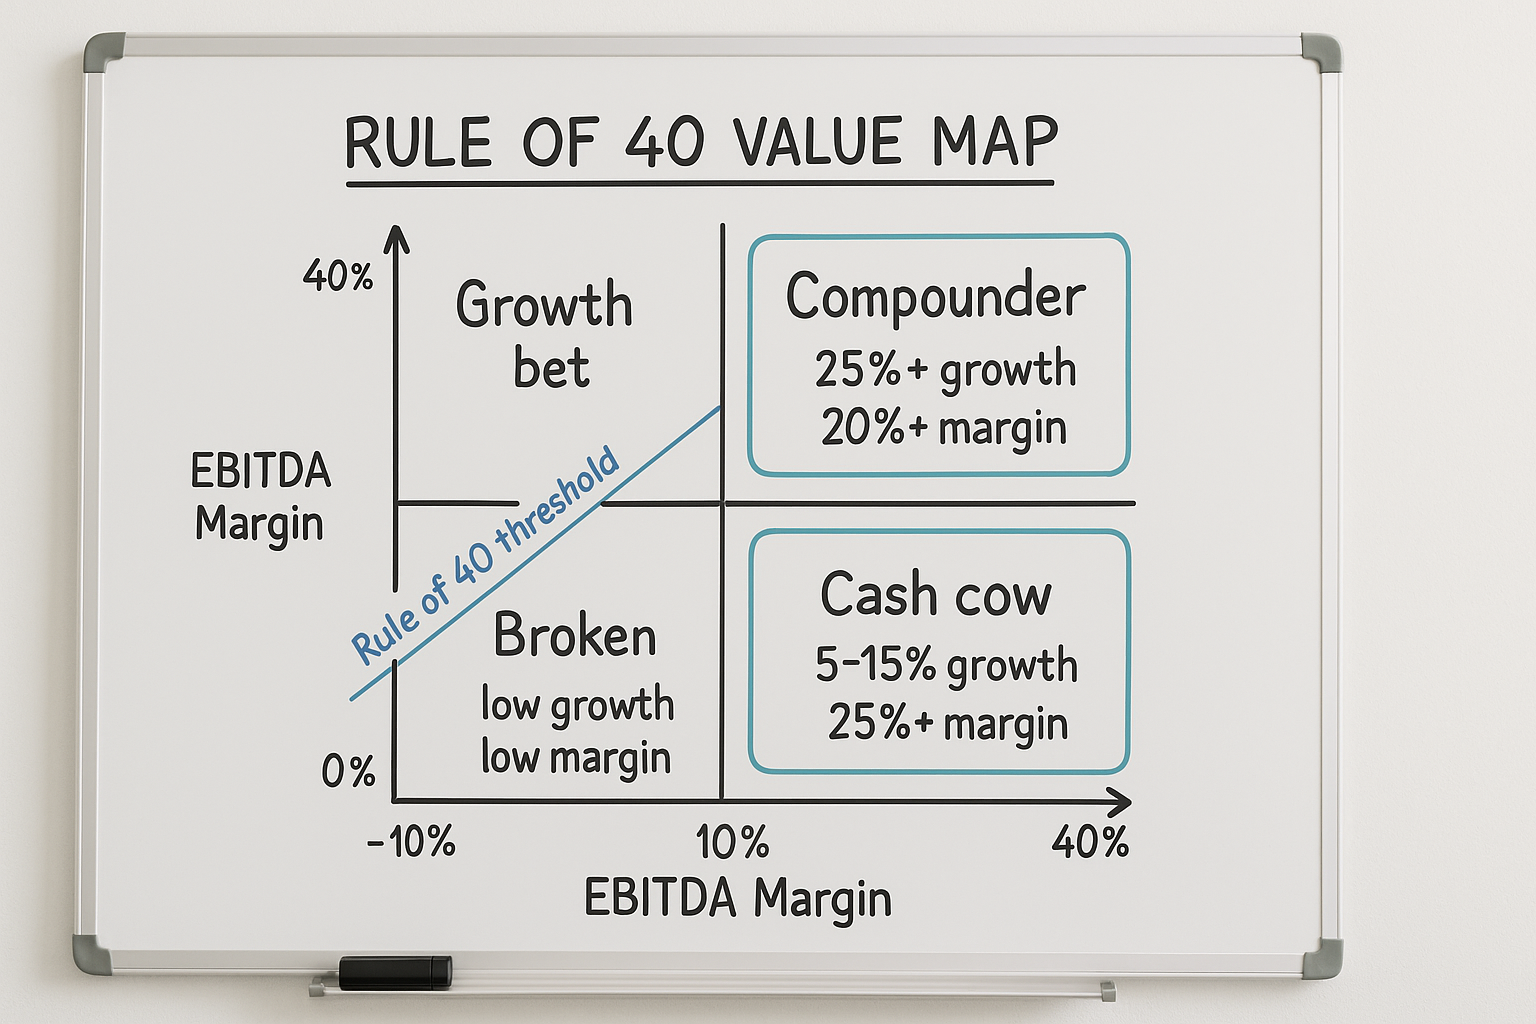
The Rule of 40 became shorthand for software business quality: add your revenue growth rate to your EBITDA margin, and if the sum exceeds 40, the business is "healthy." A company growing 30% with 15% margins qualifies, as does a company growing 10% with 35% margins.
The framework has limitations, but it captures a real tension in software businesses. Growth requires investment in sales, marketing, and product. Profitability requires efficiency in those investments. The Rule of 40 suggests that businesses can optimize for either, but not sacrifice both.
What changed between 2021 and 2024 is how the market values each side of the equation. According to Goldman Sachs' analysis, the premium for growth over profitability compressed significantly after 2022. Buyers who had been paying 15-20x revenue for high-growth, unprofitable software companies recalibrated to 8-12x for similar profiles, while profitable, slower-growth businesses held multiples more consistently.
What the reset means for underwriting
For software private equity operators, the reset shifted emphasis toward profitability and capital efficiency. A business growing 40% with negative margins now requires a credible path to profitability within the hold period. A business growing 15% with 25% margins may be a more attractive risk-adjusted entry.
This does not mean growth stopped mattering. It means buyers are no longer underwriting growth continuation at any cost. The question is whether growth is efficient, measured by metrics like CAC payback, LTV-to-CAC ratio, and sales efficiency. Inefficient growth, which burns capital to acquire customers who do not retain, is worth less than no growth at all.
Thinking through the growth-profitability tradeoff is central to private equity value creation in software. The plan must identify where the business sits on the curve and how ownership can improve the tradeoff.
Vertical versus horizontal software and the moat question
The distinction between vertical and horizontal software matters for underwriting because it maps to different competitive dynamics and retention profiles.
Horizontal software solves a general business function, such as project management, communication, or analytics, across many industries. These markets are large but competitive. The product must win on features, pricing, or distribution against well-funded alternatives. Customer switching costs are often lower because the workflow is generic.
Vertical software solves a specific workflow for a specific industry, such as practice management for dental offices, fleet management for trucking companies, or compliance tracking for community banks. These markets are smaller but defensible. The product wins by understanding the industry deeply enough that customers cannot easily switch to a generic alternative.
Why vertical SaaS buyouts command premium attention
Vertical SaaS businesses often show retention metrics that horizontal businesses struggle to match. According to Software Equity Group's M&A research, vertical SaaS companies regularly post gross retention above 95% and net retention above 115%, compared to 88% and 105% respectively for horizontal peers.
The moat in vertical software comes from several sources. First, the product often handles regulated or compliance-critical workflows, which increases switching friction. Second, the vendor accumulates industry-specific data and benchmarks that become valuable to customers. Third, distribution is more efficient because the customer profile is narrow and identifiable.
For deal teams evaluating vertical SaaS, understanding the market fragmentation of the target industry is essential. Vertical SaaS works best in fragmented end markets where customers are numerous and underserved by horizontal alternatives.
The concentration risk in vertical software
Vertical software also carries risks that horizontal businesses avoid. The total addressable market is smaller and more precisely bounded. Growth beyond the initial vertical requires either geographic expansion or a move into adjacent verticals, both of which are operationally difficult. And the end market itself may consolidate or contract, reducing the customer base structurally.
Signals of durable versus decaying recurring revenue
Not all recurring revenue is equally durable. The underwriting challenge is distinguishing between revenue that will persist through ownership and revenue that is temporarily stable but structurally at risk.
Positive signals
Workflow embeddedness. Does the product handle a core workflow that would be painful to replace? Software that manages critical data, integrates with other systems, or automates regulatory requirements is harder to cancel than software that provides optional productivity gains.
Retention that improves with tenure. If customers who have been on the platform for three years retain at 98% while first-year customers retain at 85%, the product has stickiness that emerges over time. This suggests the product becomes more valuable with use.
Expansion driven by usage. Expansion revenue from seat additions, usage growth, or module adoption indicates that customers are deepening their engagement. Expansion from price increases alone is less durable because it depends on renewal leverage that may not persist.
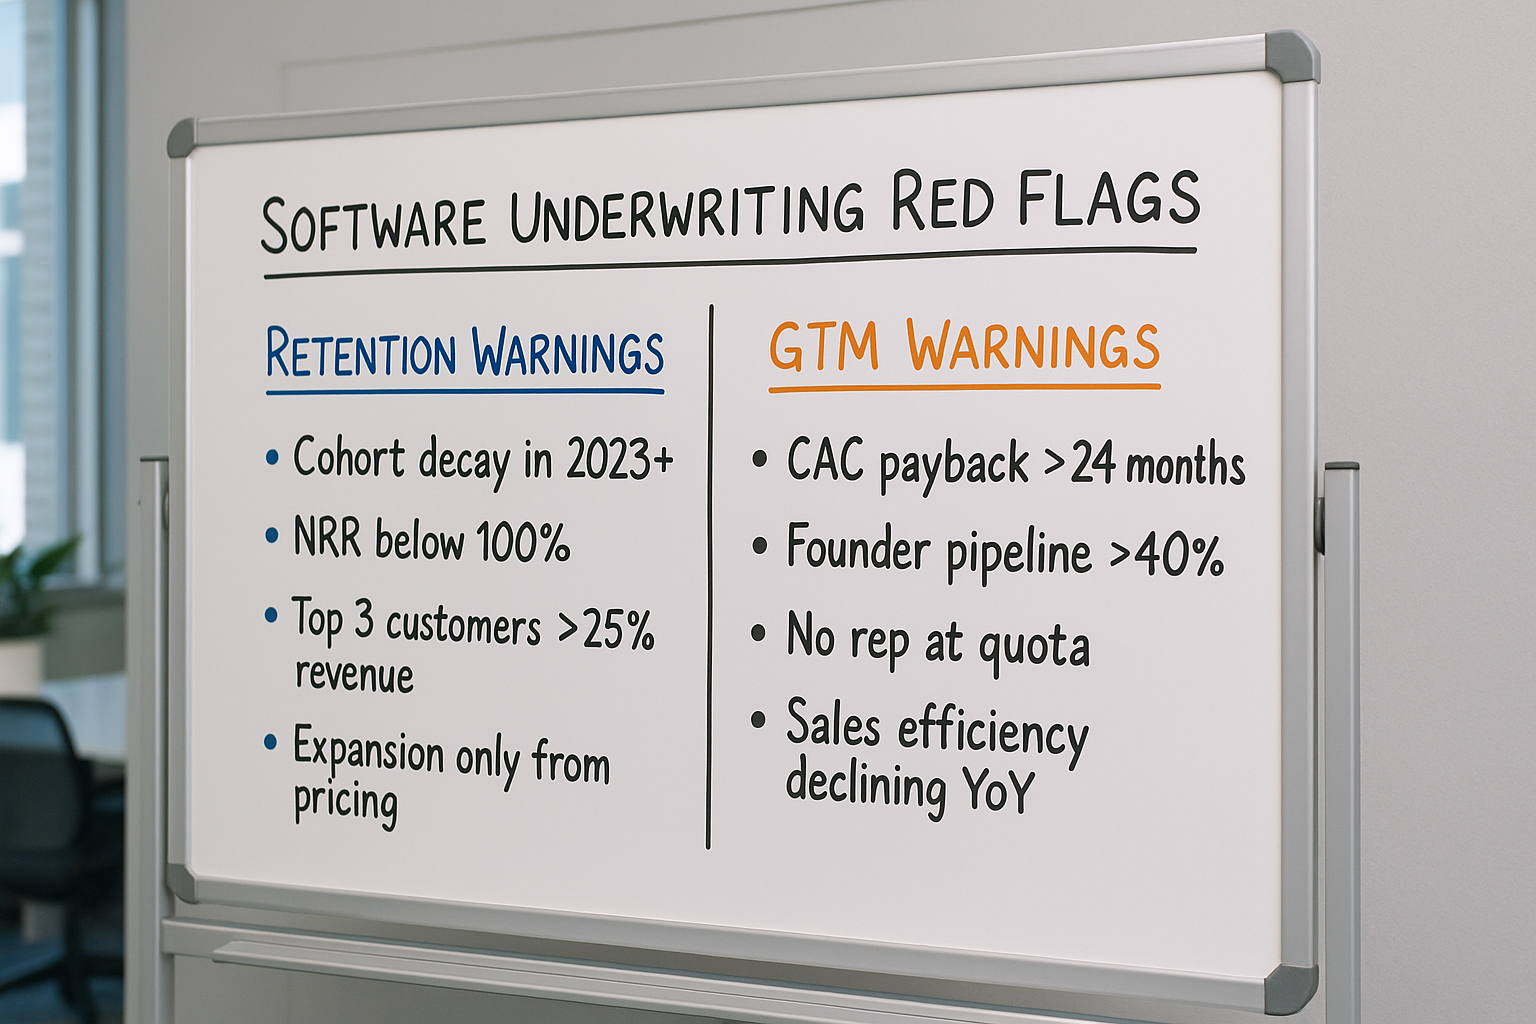
Low customer concentration. A customer base where the top 10 customers represent less than 20% of revenue is more stable than one where three customers represent 40%. Concentration amplifies renewal risk.
Negative signals
Retention dependent on inertia. Some software persists not because it is valuable but because no one has prioritized canceling it. This often correlates with low engagement metrics, minimal support ticket volume, and flat usage over time. When these accounts eventually undergo vendor review, they cancel.
Cohort decay. Newer customer cohorts retaining worse than older cohorts suggests that product-market fit is eroding, competition is increasing, or the sales team is acquiring lower-quality customers.
Single-threaded relationships. If the product is used by one person in each customer organization, that person's departure often triggers cancellation. Multi-stakeholder usage creates resilience.
Evaluating these signals requires the operator's technology diligence perspective, not just financial analysis. Understanding how customers actually use the product reveals retention durability that the metrics alone may not capture.
SaaS businesses that do not compound
The software buyout thesis assumes that recurring revenue compounds. But some software businesses have structural characteristics that prevent compounding, regardless of how the metrics look at entry.
Project-adjacent software
Some software is purchased to solve a temporary problem. Implementation consulting tools, M&A data rooms, and event management platforms often have "recurring" contracts that do not actually recur. The customer completes their project and cancels. These businesses can show annual contracts and monthly fees, but the underlying demand is project-based.
Point solutions in consolidating markets
Software that handles a narrow function in a market where platform vendors are expanding faces structural headwinds. If the dominant horizontal platform adds your feature, customers may cancel your point solution rather than maintain two vendors. This is a moat question: does the product have depth that platforms cannot easily replicate?
SMB-focused horizontal software
Small business customers churn at higher rates than enterprise customers for structural reasons. They go out of business more often, they are more price-sensitive, and they have lower switching costs. Horizontal software serving SMB markets often shows retention rates below 80%, which means the business must replace a significant portion of its customer base annually just to stay flat.
Legacy technology with no migration path
Some software businesses have durable customer bases but no path to modernization. Customers stay because migrating is expensive, not because the product is good. These businesses can generate cash flow, but they do not grow, and the customer base gradually ages out. The underwriting must account for terminal value compression.
Value-creation levers once you own the asset
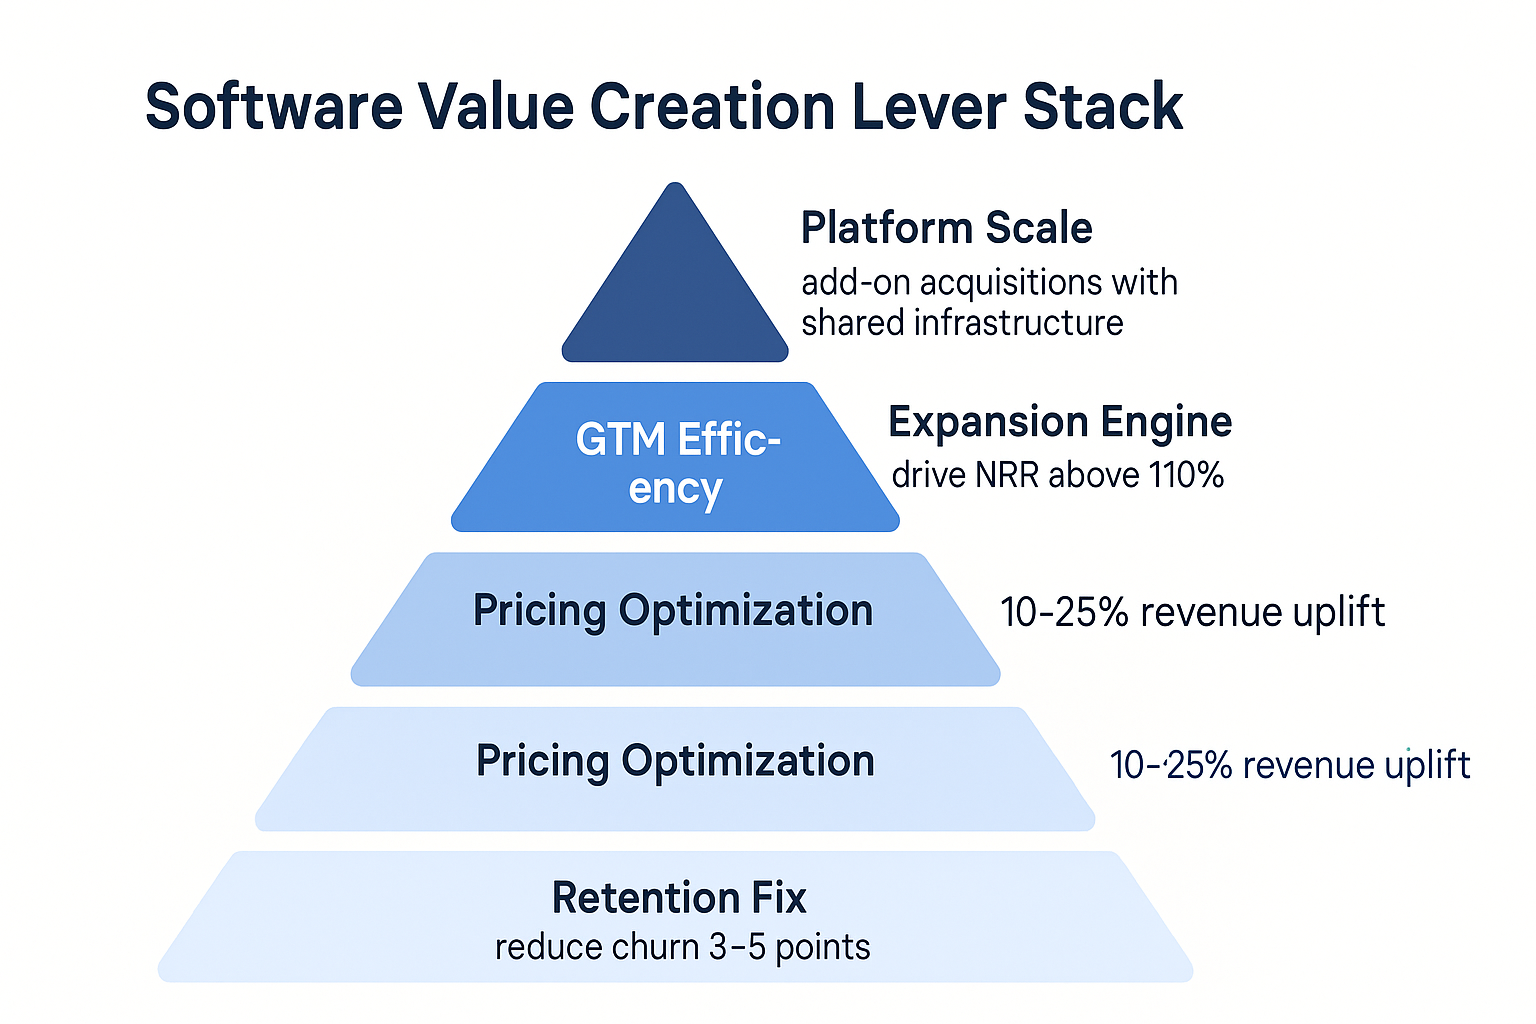
Once you own a software asset, value creation comes from improving the compounding engine. The levers are pricing, retention, and go-to-market efficiency. Each requires operational capability, not just financial engineering.
Pricing
Most founder-led software businesses underprice. According to Bain's research on software pricing, systematic pricing optimization can improve revenue by 10-25% without significant customer loss. The opportunity comes from rationalizing pricing tiers, implementing usage-based components, and capturing value from feature differentiation that is currently given away.
Pricing changes require customer communication discipline. Abrupt price increases without value justification trigger churn. The operational work is segmenting customers by willingness-to-pay, packaging features appropriately, and managing the transition.
Retention
Retention improvement comes from understanding why customers leave and fixing the root causes. This is often an operational problem, not a product problem. Customer success functions may be understaffed. Onboarding may be inconsistent. Support may be slow. The data infrastructure to identify at-risk accounts may not exist.
For businesses with churn problems, retention improvement often delivers more value than growth acceleration. A 5-point improvement in gross retention, from 85% to 90%, means the existing customer base decays 33% more slowly. That improvement compounds over the hold period.
GTM efficiency
Go-to-market efficiency measures how much revenue the sales and marketing investment produces. The operational levers include improving lead quality, reducing sales cycle length, increasing win rates, and expanding average contract value. Each requires different interventions.
A common pattern in founder-led businesses is over-reliance on founder selling. The founder's network and credibility generate disproportionate pipeline, and the sales team cannot replicate that performance. Professionalizing GTM, building repeatable playbooks, and hiring appropriately is a multi-quarter operational project.
Many software private equity strategies layer acquisitions onto a platform, using buy-and-build strategy to accelerate growth and consolidate market position. This approach requires operational infrastructure to integrate acquisitions effectively.
Software-quality underwriting scorecard
The following scorecard provides a structured framework for evaluating software business quality during diligence. Each dimension maps to the thesis mechanics discussed above. Score each on a 1-5 scale, where 5 indicates strong underwriting support and 1 indicates material concern.
| Dimension | What to Measure | Strong (4-5) | Concerning (1-2) |
|---|---|---|---|
| Gross Revenue Retention | % of contracted revenue retained before expansion | Above 90%, stable or improving across cohorts | Below 85%, or declining in recent cohorts |
| Net Revenue Retention | % of revenue retained plus expansion from existing customers | Above 110% with diversified expansion sources | Below 100%, or dependent on top 10 accounts |
| Customer Concentration | Revenue share of top 10 and top 20 customers | Top 10 below 20%, top 20 below 35% | Top 10 above 40%, or any single customer above 10% |
| Cohort Retention Trajectory | Retention rate by customer acquisition year | Recent cohorts retain at or above historical average | 2022-2024 cohorts retain 5+ points below 2019-2021 |
| CAC Payback | Months to recover customer acquisition cost | Below 18 months for primary segment | Above 30 months, or unable to measure accurately |
| Rule of 40 Position | Growth rate + EBITDA margin | Above 40 with profitability above 15% | Below 25, or profitable only through underinvestment |
| Workflow Embeddedness | How critical is the software to customer operations? | System of record, compliance-critical, or deeply integrated | Optional productivity tool, easily replaced |
| Competitive Moat | Defensibility against horizontal platforms and point solutions | Vertical depth, proprietary data, regulatory expertise | Feature competition with larger platforms, commoditized |
| Expansion Pathway | Sources of revenue growth within existing customers | Multiple upsell vectors: seats, usage, modules | Expansion only from price increases |
| GTM Repeatability | Can sales performance persist without founder involvement? | Documented playbooks, multiple performing reps | Founder-dependent pipeline, no rep hits quota |
A business scoring below 3 on multiple dimensions requires either a lower entry multiple to account for risk, or a credible operational plan to improve those dimensions within the hold period. The scorecard does not provide a definitive answer, but it structures the conversation around what matters.
When these questions matter most
The software underwriting framework applies at specific transaction milestones:
At LOI. The scorecard helps determine whether the asset is worth pursuing and what diligence questions to prioritize. Red flags at this stage may justify walking away or repricing expectations.
During confirmatory diligence. Detailed cohort analysis, customer interviews, and usage data testing validate or contradict the preliminary thesis. This is where the gap between management narrative and operational reality becomes visible.
At close. The scorecard dimensions translate into 100-day plan priorities. Which dimensions are strong and should be protected? Which dimensions are weak and require immediate operational attention?
At first board meeting. The scorecard provides a baseline for tracking improvement. Each dimension should have a target state and a timeline for reaching it.
For ongoing sector analysis and deal evaluation, private equity market intelligence resources can provide comparative context on software multiples, retention benchmarks, and transaction activity.
What software private equity underwriting requires
Software private equity attracts capital because recurring revenue, when it works, creates compounding engines that other business models cannot match. But the thesis requires specificity. Not all recurring revenue compounds. Not all retention is durable. Not all growth is efficient.
The underwriting work is distinguishing between software businesses that will compound through ownership and software businesses that merely appear to compound today. That distinction requires examining retention at the cohort level, understanding expansion sources, evaluating competitive moat, and assessing GTM repeatability.
The multiple reset since 2022 has shifted emphasis toward profitability and capital efficiency. Growth still matters, but inefficient growth is worth less than the 2021 market implied. The Rule of 40 framework captures the tradeoff, but the underlying question is whether the business has room to improve both growth and profitability, or whether improving one requires sacrificing the other.
Value creation in software ownership comes from operational work on pricing, retention, and GTM efficiency. These are not financial engineering exercises. They require understanding why customers stay, why customers leave, and how the sales motion actually functions. The scorecard provides a framework, but the work is in the details.
Key underwriting checklist:
- Pull cohort retention data for 2020-2024 and identify trajectory
- Decompose NRR into gross retention and expansion sources
- Calculate customer concentration for top 10 and top 20
- Map CAC payback by customer segment and acquisition channel
- Evaluate workflow embeddedness through customer interviews
- Assess competitive moat against both horizontal platforms and vertical specialists
- Test GTM repeatability by examining rep-level performance variance
- Identify value-creation priorities based on scorecard weaknesses
- Set baseline metrics and improvement targets for the hold period
Subscribe to the Growth Shuttle research briefing for the software-sector briefing, and download the Software-Quality Underwriting Scorecard.
Watch: Mario Peshev on Sofia Startup Society
Mario Peshev, founder of DevriX, went through this on Sofia Startup Society in November 2026. The recording is below.